Confluence 8.5 Long Term Support release performance report
Would you like to measure Confluence Data Center performance without having to run your own tests? We’ve benchmarked it for you.
In line with our performance reports for Jira and Jira Service Management, the Confluence Data Center performance report provides general performance benchmarks across versions. In particular, it includes:
Regression testing of standard Confluence actions (see Testing methodology and Test environment below)
High-impact tasks like reindexing, and backups and restores
Scale testing (up and out) with various infrastructure configurations
This report compares the performance of the Confluence Data Center 7.19 Long Term Support release with the Confluence Data Center 8.5 Long Term Support release.
 About Long Term Support releases
We recommend upgrading Confluence Data Center regularly. If your organization's processes mean you can only upgrade about once a year, upgrading to a Long Term Support release is a good option. It provides continued access to critical security, stability, data integrity, and performance issues.
On this page
Highlights
As with all Long Term Support (LTS) releases, we aim to provide the same, if not better, performance. Confluence Data Center 8.5 LTS testing demonstrates largely stable performance across the product, with a few improvements.
We saw positive advancement in the horizontal and vertical scaling behavior of Confluence Data Center, with 36% faster site reindexing saving admins more than 2 hours on the tested dataset. Faster loading times for dashboards and search will be a benefit that all Confluence users will enjoy upon upgrading to the 8.5 LTS. Here are some highlights seen during the testing we ran:
Site reindexing is now 36% faster
Scaling horizontally with 2 nodes supports 13% more users
Scaling vertically supports between 4-13% more users
Viewing dashboards is now 10% faster
Searching is now 8% faster
Commenting is now 7% faster
Viewing pages with small attachments is now 7% faster.
Most of these improvements can be attributed to investments made in upgrading the platform and libraries, as well as cache efficiency since 7.19.
Viewing blog posts was one of the few areas where we saw some performance regression (13% slower). We're investigating what may be causing this. We will continue to improve future performance and scalability so that teams can move with ease through their workspace, and our largest customers can scale confidently.
Performance
In this section, we compare Confluence Data Center 7.19 with Confluence Data Center 8.5. For both versions, we ran the same extensive test scenarios using response times for individual actions, and divided the actions into the following categories:
- Light actions
- Medium actions
- Heavy actions (that take longer to run)
The performance was measured under a user load we estimate to be peak traffic, on an instance with 5,000 users. For more details on actions and how we tested them, see Testing methodology.
Light actions
The graph shows differences in response times (ms) of light actions. You can view the data used to build the graph in the expandable content below.
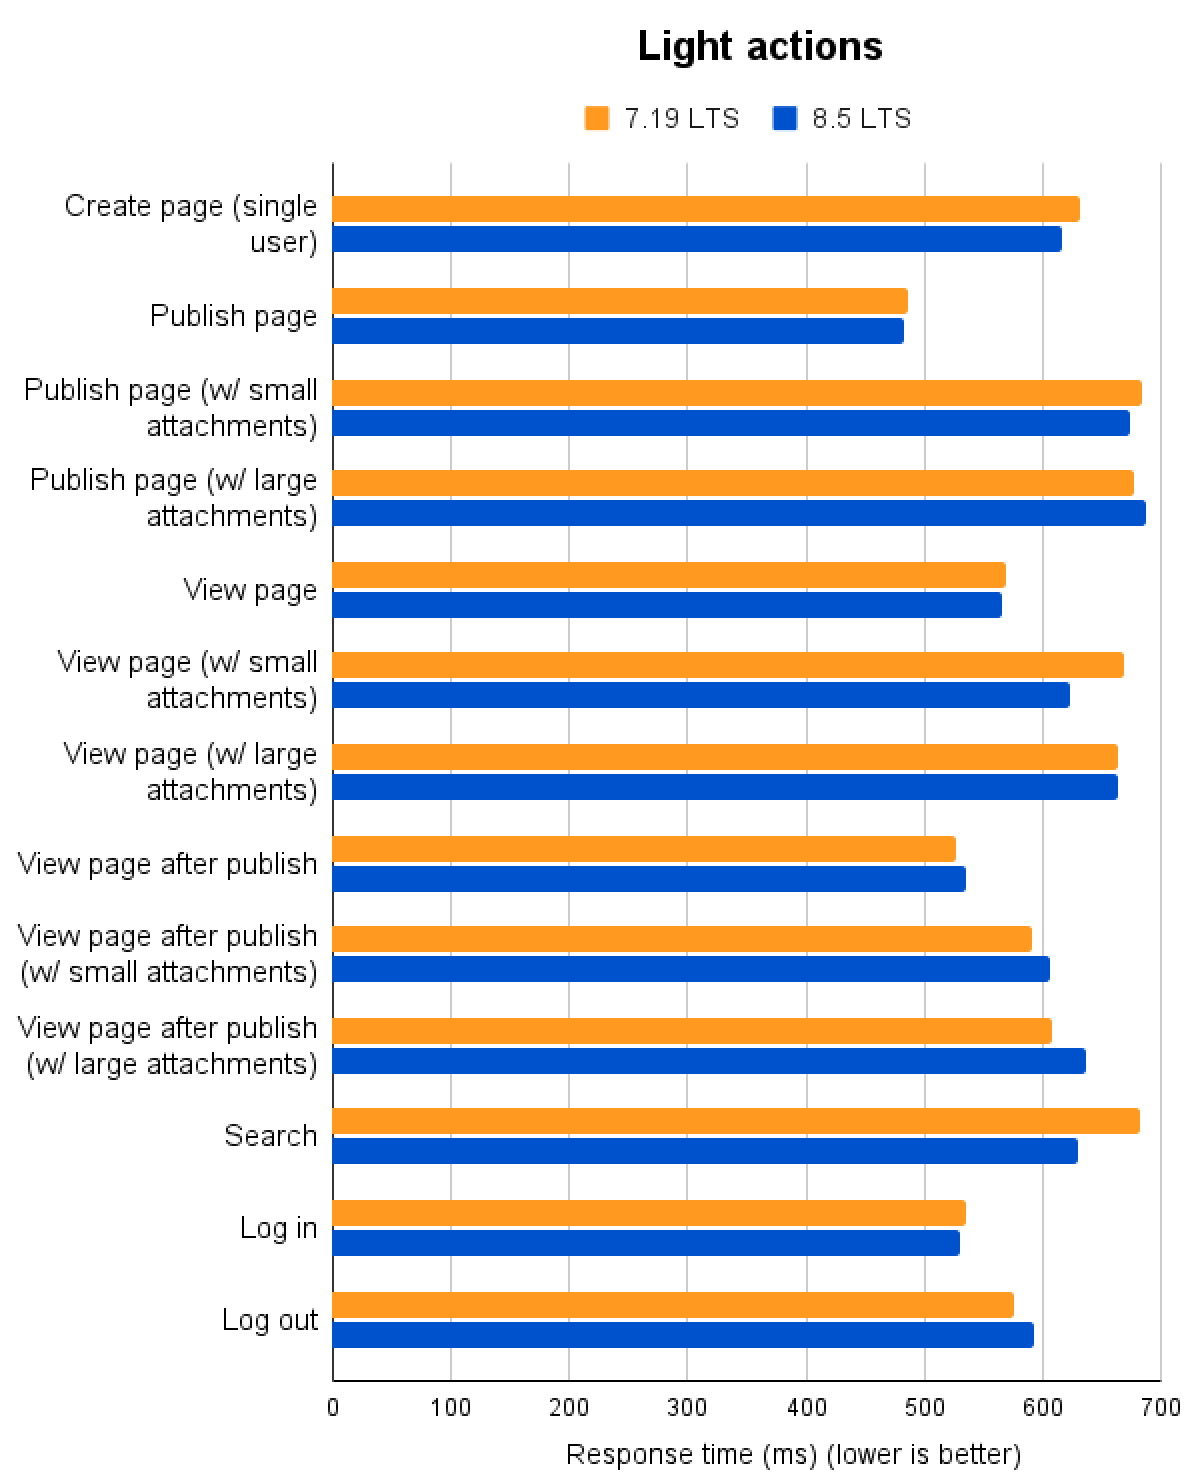
The following table presents response times (ms) for light actions.
Action | 7.19 LTS | 8.5 LTS | Change |
|---|---|---|---|
Create page (single user) | 631 | 615 | 3% faster |
Publish page | 485 | 483 | No change |
Publish page (w/ small attachments) | 683 | 673 | 1% slower |
Publish page (w/ large attachments) | 676 | 686 | 1% slower |
View page | 569 | 565 | 1% faster |
View page (w/ small attachments) | 669 |
| 7% faster |
View page (w/ large attachments) | 663 | 663 | No change |
View page after publish | 527 | 535 | 2% slower |
View page after publish (w/ small attachments) | 590 | 605 | 3% slower |
View page after publish (w/ large attachments) | 608 |
| 5% slower |
Search | 682 |
| 8% faster |
Log in | 534 | 529 | 1% faster |
Log out | 575 | 592 | 3% faster |
Medium actions
The graph shows differences in response times (ms) of medium actions. You can view the data used to build the graph in the expandable content below.
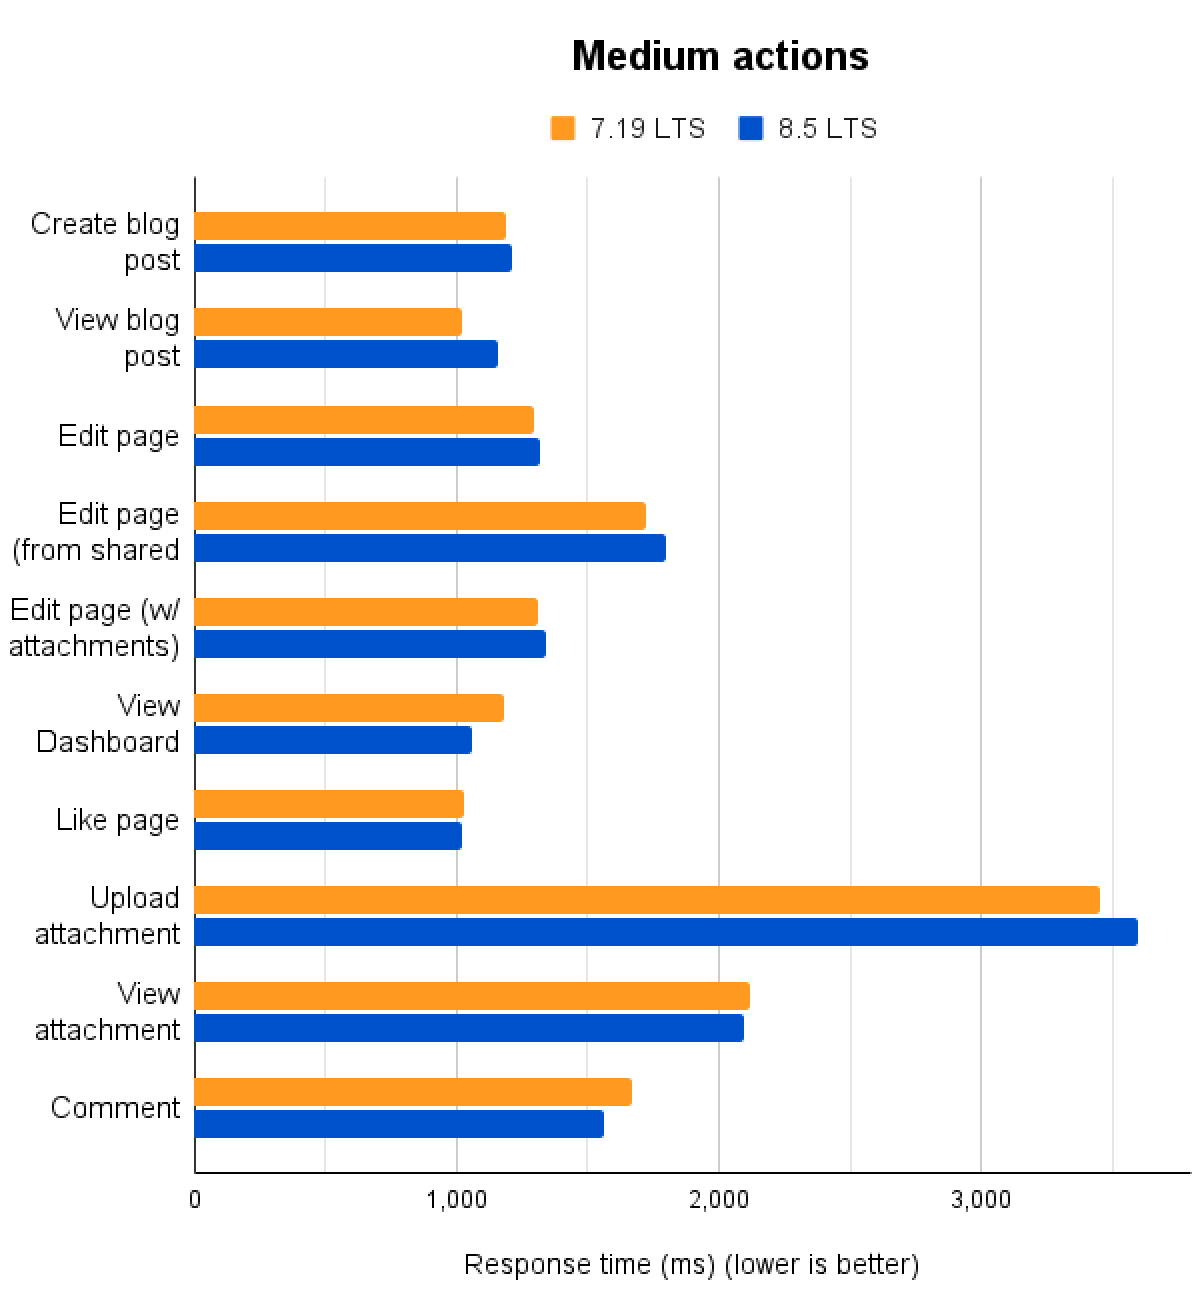
The following table presents response times (ms) for medium actions.
Action | 7.19 LTS | 8.5 LTS | Change |
|---|---|---|---|
Create page (collaborative) | 1,551 | 1,565 | 1% slower |
Create blog post | 1,190 | 1,209 | 2% slower |
View blog post | 1,019 |
| 13% slower |
Edit page | 1,298 | 1,315 | 1% slower |
Edit page (from shared link) | 1,719 |
| 5% slower |
Edit page (w/ attachments) | 1,313 | 1,344 | 2% slower |
View Dashboard | 1,178 |
| 10% faster |
Like page | 1,027 | 1,020 | 1% faster |
Upload attachment | 3,452 | 3,599 | 4% slower |
View attachment | 2,120 | 2,099 | 1% faster |
Comment | 1,671 |
| 7% faster |
Heavy actions
The graph shows differences in response times (hours) of one heavy action. You can view the data used to build the graph in the expandable content below.

The following table presents the time (hours) for one heavy action.
Action | 7.19 LTS | 8.5 LTS | Change |
|---|---|---|---|
Site reindexing | 6 hrs 38 mins |
| 36% faster |
A note on backups and restores
Another performance and scale benefit we would like to highlight for customers upgrading from the 7.19 LTS are the significant improvements in Confluence's backup and restore system. Previously unreliable and prone to failure, updates released in Confluence 8.3 have resulted in the following improvements:
Full site backup is now 10x faster for medium instances, and up to 48x faster for very large instances
Space backup is now 8x faster
Site restore is significantly faster and more reliable while scaling without requiring additional memory
Due to technical barriers, we were unable to run backup and restore testing on the 7.19 LTS, so have instead included information from the 8.3 release given the relevance of these improvements to customers upgrading from the 7.19 LTS.
The following table presents the time for backup and restore actions.
Action | Pre-8.3 | 8.3 | Change |
|---|---|---|---|
Full site backup | 96 hrs |
| 48x faster |
Space backup | 1 hr 3 mins |
| 8x faster |
Site restore | Incapable of completion |
| Significantly improved |
Capacity testing
In this section, we tested different infrastructure configurations so you can make a comparison with the one most similar to your infrastructure. We divided the actions into the following categories:
Horizontal scaling (adding more nodes)
Vertical scaling (adding more capacity)
The purpose of these tests is to benchmark Confluence versions against each other, and these testing configurations are therefore unsuitable for comparing scaling options. These tests show comparisons between Confluence versions only.
Horizontal scaling
We tested on the following instance types:
an m5.2xlarge instance with 1 node
an m5.2xlarge instance with 2 nodes
an m5.2xlarge instance with 4 nodes
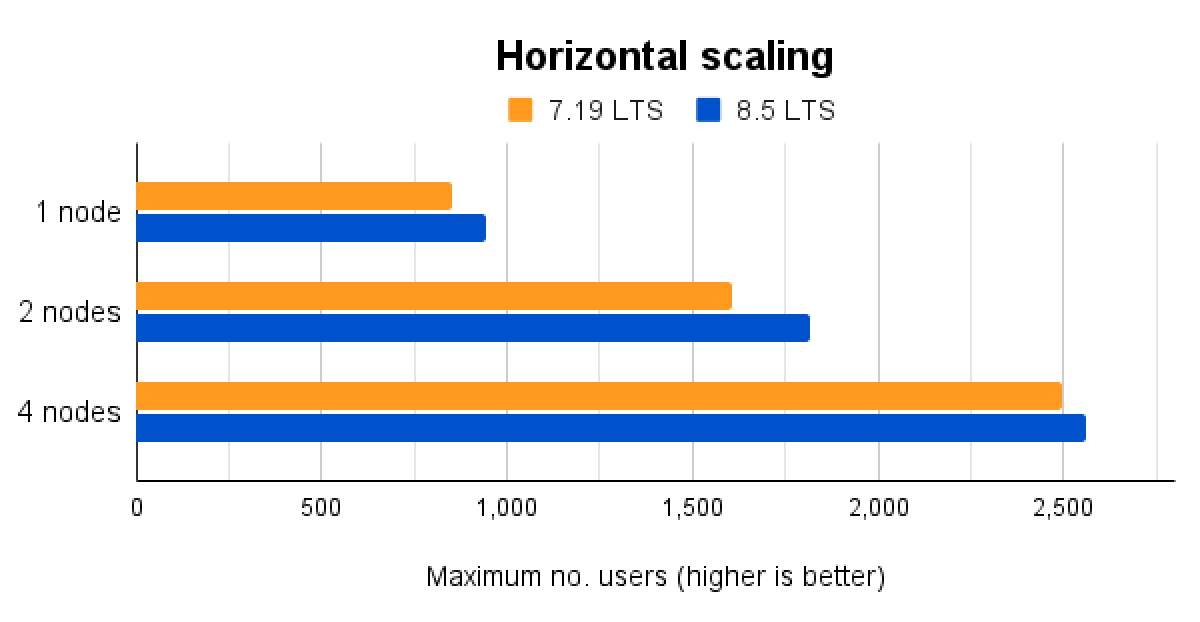
The following table presents the maximum number of users during horizontal scaling.
Action | 7.19 LTS | 8.5 LTS | Change |
|---|---|---|---|
1 node | 852 |
| 11% more maximum users |
2 nodes | 1,608 |
| 13% more maximum users |
4 nodes | 2,494 | 2,560 | 3% more maximum users |
Vertical scaling
We tested on the following instance types:
an m5.xlarge instance with 4vCPU and 16GiB
an m5.2xlarge instance with 8vCPU and 32GiB
an m5.4xlarge instance with 16vCPU and 64GiB
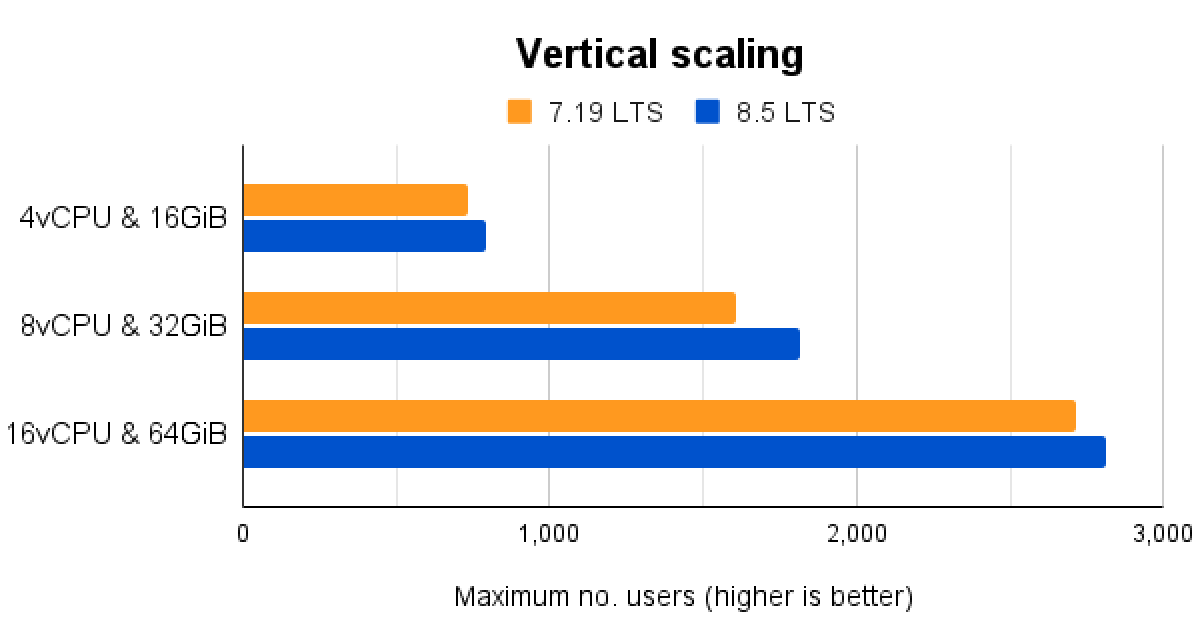
The following table presents the maximum number of users during vertical scaling.
Action | 7.19 LTS | 8.5 LTS | Change |
|---|---|---|---|
4vCPU & 16GiB | 734 |
| 8% more maximum users |
8vCPU & 32GiB | 1,608 |
| 13% more maximum users |
16vCPU & 64GiB | 2,712 | 2,812 | 4% more maximum users |
Testing methodology
The following sections detail the testing environment, including hardware specifications and the methodology we used in our performance tests.
How we tested
The following table represents the dataset we used in our tests:
Data | Value |
|---|---|
Pages | ~900,000 |
Blogposts | ~100,000 |
Attachments | ~2,300,000 |
Comments | ~6,000,000 |
Spaces | ~5,000 |
Users | ~5,000 |
Actions performed
We chose a mix of actions that would represent a sample of the most common user actions. An action in this context is a complete user operation, like opening a page in the browser window. The following table details the actions that we included in the script, for our testing persona, indicating how many times each action is repeated during a single test run.
Action | Number of times an action is performed in a single test run |
|---|---|
Create page (single user) | 417 |
Publish page | 255 |
Publish page (w/ small attachments) | 37 |
Publish page (w/ large attachments) | 19 |
View page | 497 |
View page (w/ small attachments) | 124 |
View page (w/ large attachments) | 38 |
View page after publish | 259 |
View page after publish (w/ small attachments) | 41 |
View page after publish (w/ large attachments) | 20 |
Search | 2,092 |
Log in | 623 |
Log out | 311 |
Create page (collaborative) | 623 |
Create blog post | 1,673 |
View blog post | 311 |
Edit page | 623 |
Edit page (from shared link) | 623 |
Edit page (w/ attachments) | 18 |
View Dashboard | 623 |
Like page | 612 |
Upload attachment | 1,217 |
View attachment | 1,041 |
Comment | 935 |
Site reindexing | 1 |
Test environment
The performance tests were all run on a set of AWS EC2 instances. For each test, the entire environment was reset and rebuilt, and then each test started with some idle cycles to warm up instance caches. Below, you can check the details of the environments used for Confluence Data Center, as well as the specifications of the EC2 instances.
To run the tests, we used four scripted browsers and 220 background threads representing virtual users, and measured the time taken to perform the actions. Each browser was scripted to perform a random action from a predefined list of actions, then to move on immediately to the next action (allowing for zero think time). Each background thread was similarly scripted to perform a random action from the list of backend API calls, then to move on immediately to the next call. This resulted in each browser/thread performing substantially more tasks than would be possible by a real user.
Before we ran each test, we started with a five-minute warm-up, then ran each test for 60 minutes.
For capacity tests, we slowly ramped up the number of background threads representing virtual users until we reached saturation point.
All tests were run a number of times for consistent results.
Here are the details of our Confluence Data Center test environment:
2 Confluence nodes
Database on a separate node
Load generator on a separate node
Shared home directory on a separate NFS Server node
Load Balancer (AWS ALB Application Load Balancer)
Confluence Data Center with 2 nodes
Hardware | Software | ||
|---|---|---|---|
EC2 type | m5.2xlarge | Operating system | Amazon Linux 2 |
vCPUs | 8 | Java platform | Java 11.0.9.1 |
Memory (GiB) | 32 | Java options | 8 GB heap |
Physical Processor | Intel Xeon Platinum 8175 | ||
Clock Speed (GHz) | 3.1 | ||
CPU Architecture | x86_64 | ||
Storage | AWS EBS 200 GB GP2 | ||
Database
Hardware | Software | ||
|---|---|---|---|
EC2 type | db.m5.xlarge | Database: | PostgreSQL 10.17 |
vCPUs | 4 | Operating system: | Amazon Linux 2 |
Memory (GiB) | 16 | ||
Physical Processor | Intel Xeon Platinum 8175 | ||
CPU Architecture | 64-bit | ||
Clock Speed (GHz) | 2.5 | ||
Storage | AWS EBS 700 GB GP2 | ||
NFS server
Hardware | Software | ||
|---|---|---|---|
EC2 type | m4.large | Operating system | Amazon Linux 2 |
vCPUs | 2 | ||
Memory (GiB) | 8 | ||
Memory per vCPU (GiB) | 4 | ||
Physical Processor | Intel(R) Xeon(R) CPU E5-2686 v4 | ||
Clock Speed (GHz) | 2.3 | ||
CPU Architecture | x86_64 | ||
Storage | AWS EBS 100 GB GP2 | ||
Load generator
Hardware | Software | ||
|---|---|---|---|
vCPUs | 5 | Operating system | Ubuntu 22.04.3 LTS |
Memory (GiB) | 20 | Python version | 3.11 |
Physical Processor | Intel(R) Xeon(R) Platinum 8375C | ||
Clock Speed (GHz) | 2.9 | ||
CPU Architecture | x86_64 | ||
Note: for the capacity tests, the environment consisted of either 1/2/4 Confluence nodes or the right EC2 size m5.xlarge/m5.2xlarge/m5.4xlarge