Jira Service Management 5.4.x Long Term Support release performance report
This page compares the performance of Jira Service Management 4.20 with Jira Service Management 5.4 Long Term Support release.

About Long Term Support releases
We recommend upgrading Jira Service Management regularly, but if your organization's process means you only upgrade about once a year, upgrading to a Long Term Support release is a good option. It provides continued access to critical security, stability, data integrity and performance issues until this version reaches end of life.
Performance
As with all Long Term Support releases, we aim to provide the same, if not better, performance. Jira Service Management 5.4 testing demonstrates significant performance improvements in viewing workload reports and Assets import speed and scaling. We also saw notable improvements in viewing the customers page, viewing service issues, and creating a customer request.
Some performance regressions were seen in viewing requests, viewing queues and Assets object creation. These can be attributed to functional improvements made in the product since Jira Service Management 4.20 LTS.
In this section, we’ll compare Jira Service Management 4.20 to Jira Service Management 5.4, for both Server and Data Center. We ran the same extensive test scenario for both versions, divided into four categories:
Lighter actions
Medium actions
Heavy actions (that take longer to run)
Insight actions (related to the asset management functionality)
The performance was measured under a user load we estimate to be peak traffic, on an instance with 5000 users. For more details on actions and how we tested them, see Testing methodology .
Lighter actions
The graph shows differences in response times of individual actions. You can view the data used to build the graph below.
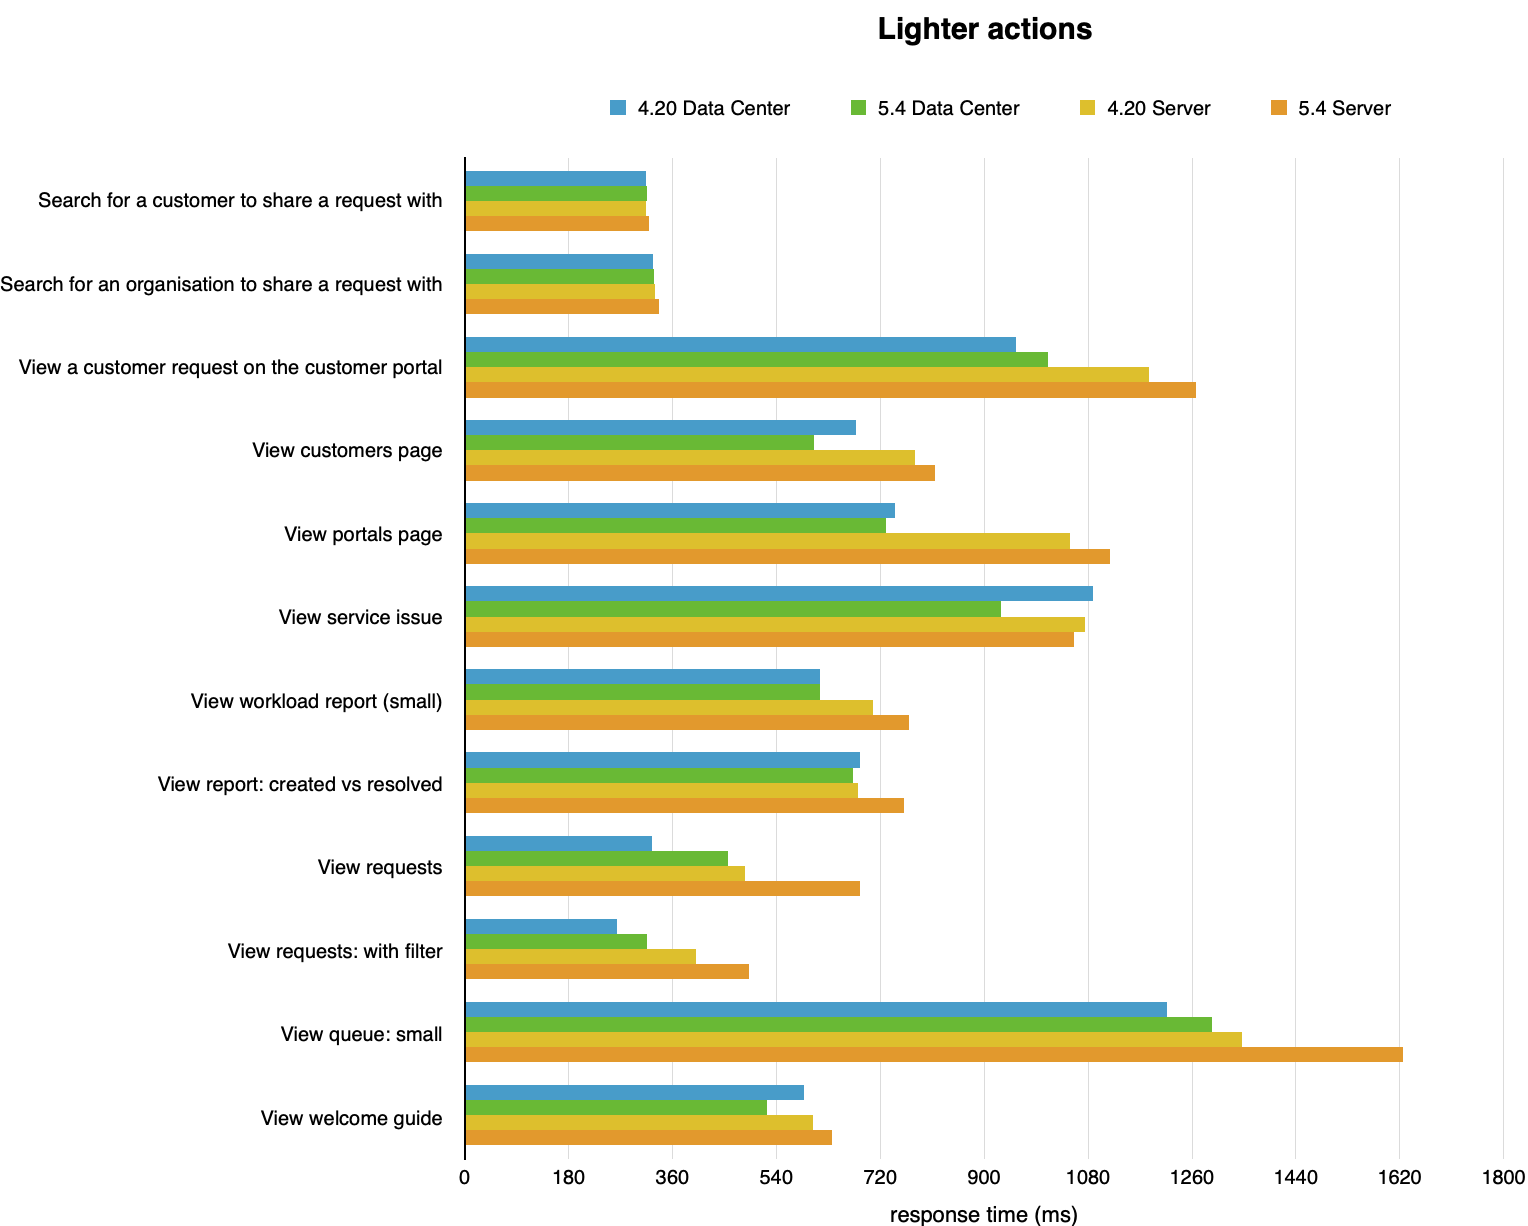
The following table presents mean response times for lighter actions.
Action | Average response times (in milliseconds, lower is better) | |||
4.20 Server | 5.4 Server | 4.20 Data Center | 5.4 Data Center | |
|---|---|---|---|---|
Search for a customer to share a request with | 313 | 319 | 314 | 316 |
Search for an organization to share a request with | 329 | 337 | 326 | 327 |
View a customer request on the customer portal | 1185 | 1266 | 954 | 1,010 |
View customers page | 779 | 814 | 678 | 605 |
View portals page | 1048 | 1117 | 745 | 730 |
View a service issue | 1074 | 1056 | 1088 | 929 |
View workload report (small) | 707 | 769 | 616 | 616 |
View report: created vs resolved | 681 | 761 | 684 | 673 |
View requests | 486 | 685 | 325 | 455 |
View requests: with filter | 400 | 493 | 264 | 315 |
View queue: small | 1346 | 1625 | 1216 | 1294 |
View welcome guide | 603 | 636 | 588 | 524 |
Medium actions
The graph shows differences in response times of individual actions. You can view the data used to build the graph below.
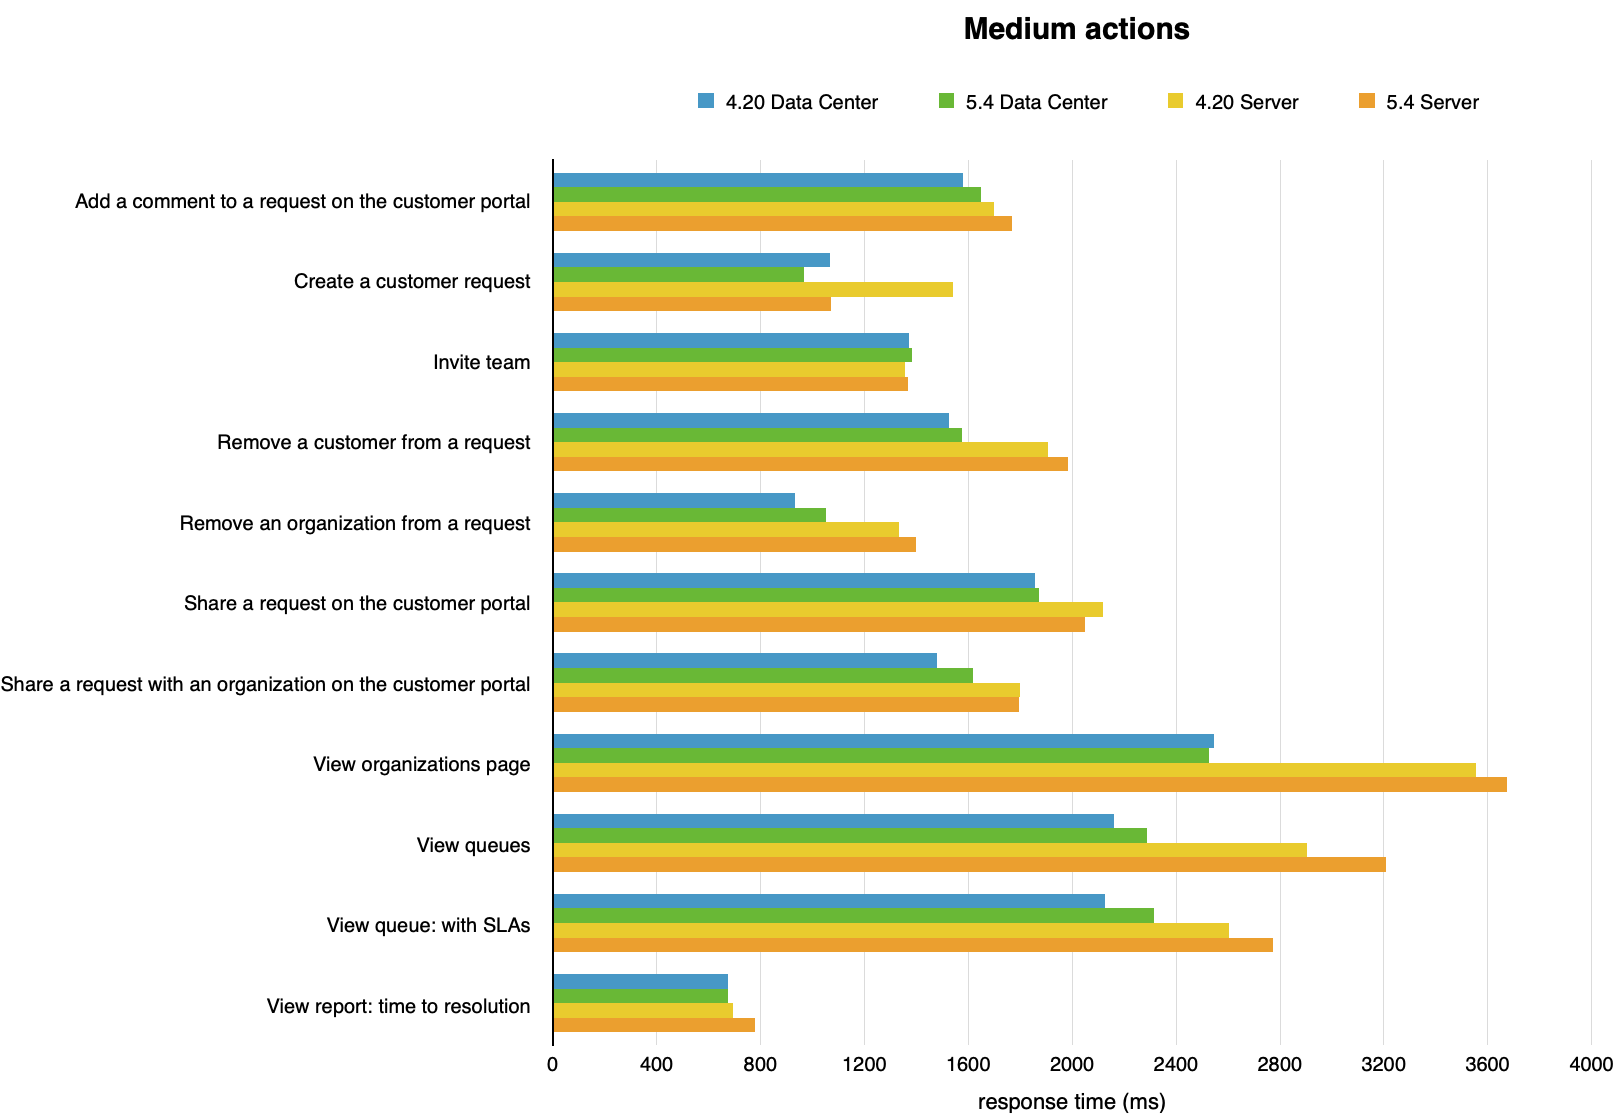
The following table presents mean response times for medium actions.
Action | Average response times (in milliseconds, lower is better) | |||
4.20 Server | 5.4 Server | 4.20 Data Center | 5.4 Data Center | |
|---|---|---|---|---|
Add a comment to a request on the customer portal | 1697 | 1767 | 1580 | 1649 |
Create a customer request | 1539 | 1069 | 1068 | 968 |
Invite team | 1356 | 1366 | 1373 | 1383 |
Remove a customer from a request | 1906 | 1984 | 1527 | 1577 |
Remove an organization from a request | 1334 | 1398 | 933 | 1052 |
Share a request with a customer on the customer portal | 2118 | 2047 | 1855 | 1870 |
Share request with an organization on customer portal | 1798 | 1796 | 1478 | 1616 |
View organizations page | 3554 | 3672 | 2547 | 2526 |
View queues | 2904 | 3207 | 2161 | 2288 |
View queue: with SLAs | 2604 | 2772 | 2126 | 2315 |
View report: time to resolution | 694 | 780 | 675 | 673 |
Heavy actions
The graph shows differences in response times of individual actions. You can view the data used to build the graph below.
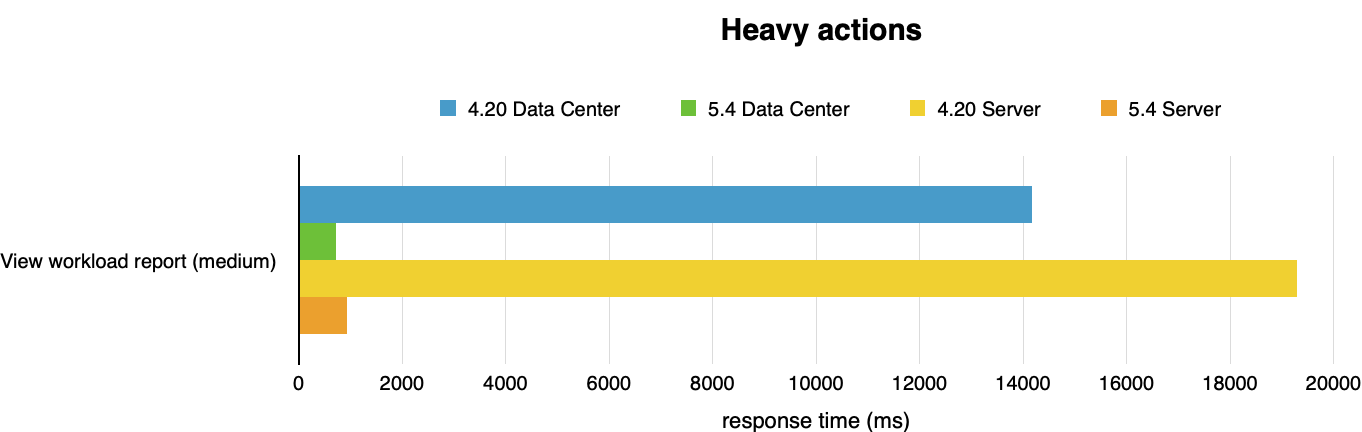
The following table presents mean response times for heavy actions.
Action | Average response times (in milliseconds, lower is better) | |||
4.20 Server | 5.4 Server | 4.20 Data Center | 5.4 Data Center | |
|---|---|---|---|---|
View workload report (medium) | 19288 | 935 | 14164 | 728 |
Assets actions
The graph shows differences in response times of individual actions. You can view the data used to build the graph below.
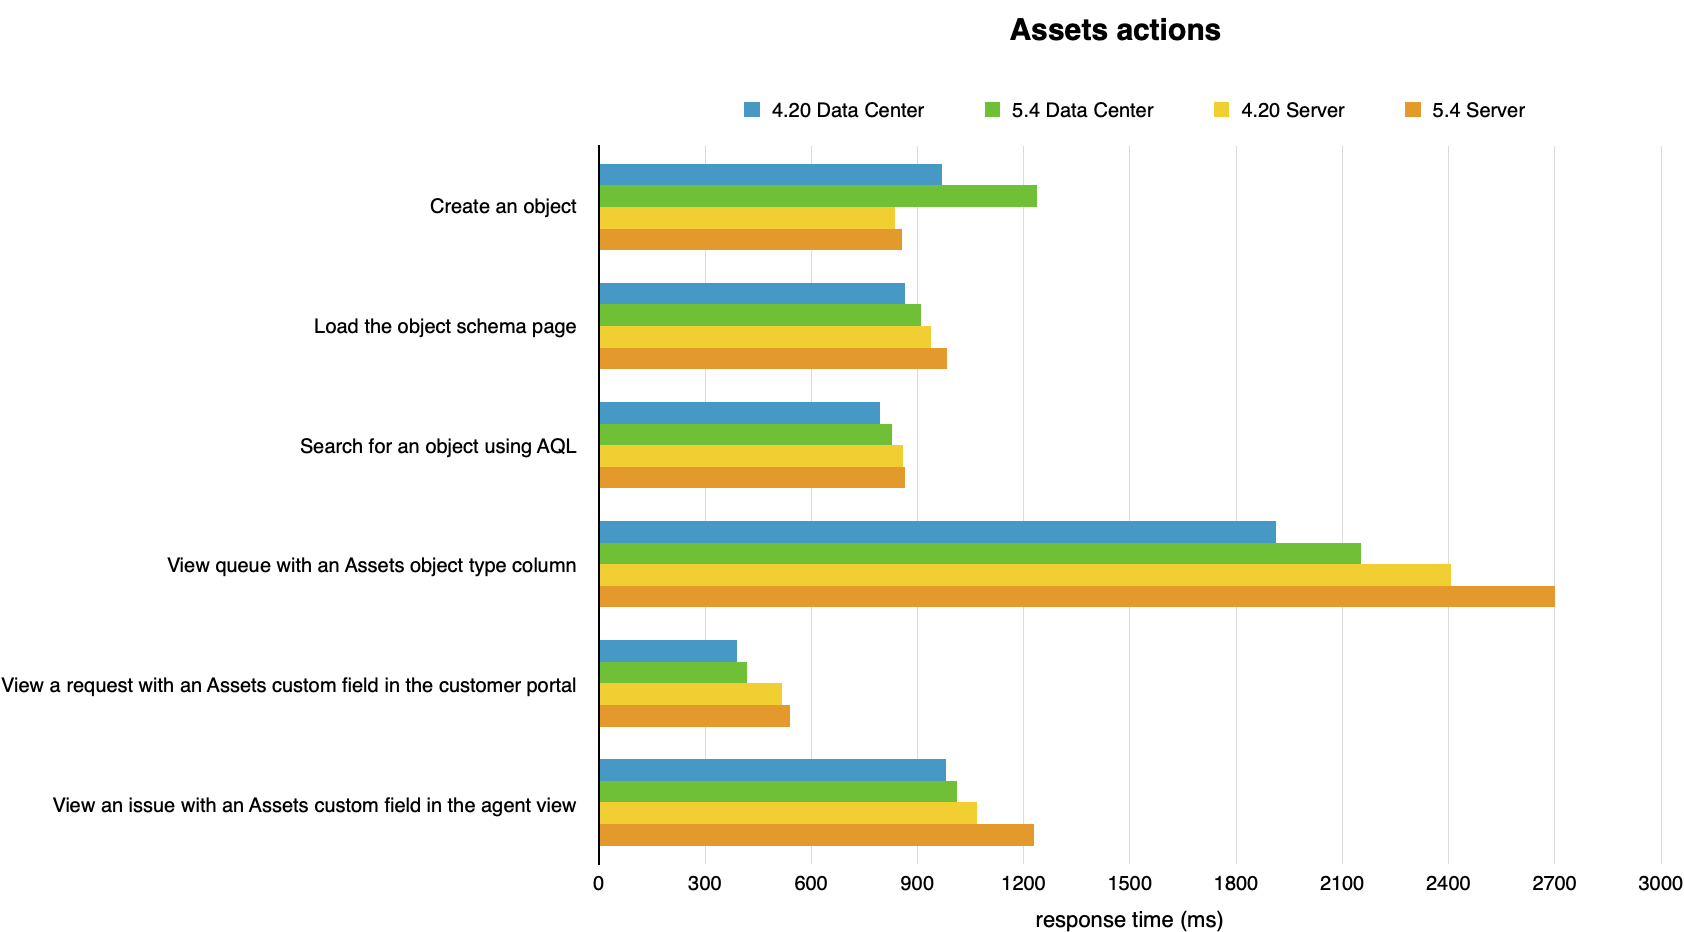
The following table presents mean response times for Assets actions.
Action | Average response times (in milliseconds, lower is better) | |||
4.20 Server | 5.4 Server | 4.20 Data Center | 5.4 Data Center | |
|---|---|---|---|---|
Create an Assets object | 837 | 855 | 970 | 1237 |
Load the object schema page | 939 | 982 | 864 | 910 |
Search for an object using IQL | 860 | 866 | 795 | 827 |
View a queue with an Assets object type column | 2408 | 2700 | 1912 | 2152 |
View a request with an Assets custom field in the customer portal | 516 | 539 | 390 | 417 |
View an issue with an Assets custom field in the agent view | 1068 | 1230 | 981 | 1012 |
Assets import speed and scaling
In addition to the performance of user operations in the product, we also made improvements to the way Assets uses memory, performs imports, and handles bulk operations.
Import object creation is now 55-70% faster.
Large datasets now require 20-35% less memory.
Assets reindexing is now 10x faster.
Querying and importing complex object type hierarchies is now up to 25x faster*.
Bulk deleting objects via the Assets user interface is now 4.8x faster.
Offloading imports to the disk rather than the memory means that Assets now supports much larger imports than previously.
* Demonstrated with National Vulnerability Database (NVD) import speed
In summary
The performance is largely stable across the product and under high load, with a few improvements. The highlights:
Viewing workload reports (medium) is now 19.4x faster.
Viewing the customers page is now 1.1x faster.
Viewing service issues is now 1.2x faster.
Creating a customer request is now 1.1x faster.
Import object creation is now 55-70% faster.
Large datasets now require 20-35% less memory.
Some performance regressions were seen in viewing requests, viewing queues and Assets object creation. These can be attributed to new request list functionality (4.21 and 5.3), changes made to improve SLA calculation accuracy (5.0), and various accessibility and user interface improvements in Assets (5.0, 5.1, 5.2, 5.3).
We will continue to improve future performance so that service teams can move with ease through their workspace, and our largest customers can scale confidently.
Testing methodology
The following sections detail the testing environment, including hardware specification, and methodology we used in our performance tests.
How we tested
Before we started testing, we needed to determine what size and shape of dataset represents a typical large Jira Service Management instance. To achieve that, we used our Analytics data to form a picture of our customers' environments and what difficulties they face when scaling Jira Service Management in a large organization.
We’ve also included a dataset for Assets, since it’s part of Jira Service Management Data Center.
The following table presents the rounded values of the 99th percentile of each data dimension. We used these values to generate a sample dataset with random test data.
Baseline data set
Data | Value |
|---|---|
Admin | 1 |
Comments | 609570 |
Components | 7195 |
Custom fields | 42 |
Groups | 3 |
Issue types | 13 |
Issues | 302109 |
Agents | 1000 |
Priorities | 5 |
Projects | 1001 |
Resolutions | 8 |
Screen schemas | 2395 |
Screens | 14934 |
Statuses | 23 |
Users | 101003 |
Versions | 3 |
Workflows | 3717 |
Assets data set
Data | Value |
|---|---|
Object schemas | 6 |
Object types | 341 |
Objects | 315837 |
Attributes | 2488972 |
Actions performed
We chose a mix of actions that would represent a sample of the most common user actions. An action in this context is a complete user operation, like opening an issue in the browser window. The following table details the actions that we included in the script, for our testing persona, indicating how many times each action is repeated during a single test run.
Lighter, medium, and heavy actions
Action | Description | Number of times an action is performed in a single test run |
|---|---|---|
Add a comment to a request on the customer portal | Open a random customer request in the portal and, as an agent, add a random comment to it. | ~240 |
Create a customer request | Open a customer portal, type in the issue summary and description, then submit the request. | ~140 |
Invite team | Select Invite team in the left-hand-side menu, search for an agent on a 1,000 agent instance, choose an agent, click the Invite button, and wait for success confirmation. | ~150 |
Remove a customer from a request | Open a random customer request in the portal, and remove a random customer from the "Shared with" column. | ~140 |
Remove an organization from a request | Open a random customer request in the portal, and remove a random organization on the "shared with" column. | ~140 |
Search for an organization to share a request with | Open a random customer request in the portal, and search for a random organization to share the request with. | ~140 |
Search for a customer to share a request with | Open a random customer request in the portal, and search for a random customer to share the request with. | ~140 |
Share a request with an organization on the customer portal | Open a random customer request in the portal, and share the request with a random organization. | ~140 |
Share a request with a customer on the customer portal | Open a random customer request in the portal, and share the request with a random customer. | ~140 |
View workload report (small) | Display the workload report for a project with no open issues. | ~210 |
View workload report (medium) | Display the workload report for a project with 1,000 assigned issues and 700 agents. | ~220 |
View queue: all open issues | Display the default service queue, in a project with over 10,000 open issues. | ~720 |
View queue: small | Display a custom service queue that will filter out most of the issues, in a project with over 10,000 open issues. | ~820 |
View queue: with SLAs | Display a custom service queue, in a project with over 10,000 open issues, with 6 SLA values for each issue. | ~700 |
View customers page | Display the Customers page, in a project that has 100,000 customers. | ~340 |
View organizations page | Display the Customers page, in a project that has 50 organizations and 300 customers. | ~340 |
View portals page | Display the help center, with all customer portals, by selecting the unique help center link. | ~810 |
View report: created vs resolved | Display the Created vs Resolved report (in the past year), with over 10,000 issues in the timeline. | ~210 |
View report: time to resolution | Display the Time to resolution report (in the past year), with over 10,000 issues in the timeline. | ~220 |
View requests | Display the My requests screen from the customer portal. | ~840 |
View requests: with filter | Display the My requests screen from the customer portal, filtering the results with a single word in the summary. | ~840 |
View service issue | Display a service issue with 6 SLA values in the Agent view. | ~830 |
View a customer request on the customer portal | Display a random issue in the customer portal. | ~520 |
View welcome guide | Display the Welcome guide from the left-hand-side menu. | ~210 |
Assets actions
Action | Description | Number of times an action is performed in a single test run |
|---|---|---|
Create an object | Create an Assets object in an existing object schema. | ~170 |
Load the object schema page | Open an existing object schema. | ~530 |
View a queue with an Assets object type column | Display a custom queue that has an Assets Object Column in the results. It should return around 1000 issues. | ~420 |
Search for an object using IQL | Search for objects using IQL in an existing object schema. | ~200 |
View a request with an Assets custom field in the customer portal | Open a customer request that includes an Assets custom field. | ~450 |
View an issue with an Assets custom field in the agent view | Open an issues that includes an Assets custom field. | ~210 |
Test environment for user actions
The performance tests were all run on a set of AWS EC2 instances. For each test, the entire environment was reset and rebuilt, and then each test started with some idle cycles to warm up instance caches. Below, you can check the details of the environments used for Jira Service Management Server and Data Center, as well as the specifications of the EC2 instances.
To run the tests, we used 21 scripted browsers and measured the time taken to perform the actions. Each browser was scripted to perform a random action from a predefined list of actions and immediately move on to the next action (ie. zero think time). Note that this resulted in each browser performing substantially more tasks than would be possible by a real user, and you should not equate the number of browsers to represent the number of real-world concurrent users.
Each test was run for 40 minutes, after which statistics were collected.
Here are the details of our test environment:
| Jira Service Management Server | Jira Service Management Data Center |
|---|---|
The environment consisted of:
| The environment consisted of:
|
| Jira Service Management for Server | |||
|---|---|---|---|
| Hardware | Software | ||
| EC2 type: |
1 node | Operating system | Ubuntu 16.04 LTS |
| CPU: | Intel Xeon E5-2666 v3 (Haswell) | Java platform | Java 1.8.0 |
| CPU cores: | 36 | Java options | 16 GB heap |
| Memory: | 60 GB | ||
| Disk: | AWS EBS 100 GB gp2 | ||
| Jira Service Management for DC | |||
|---|---|---|---|
| Hardware | Software | ||
| EC2 type: |
1 node | Operating system | Ubuntu 16.04 LTS |
| CPU: | Intel Xeon Platinum 8000 series (Skylake-SP) | Java platform | Java 1.8.0 |
| CPU cores: | 16 | Java options | 16 GB heap |
| Memory: | 32 GB | ||
| Disk: | AWS EBS 100 GB gp2 | ||
| Database | |||
|---|---|---|---|
| Hardware | Software | ||
| EC2 type: | m4.2xlarge (see EC2 types ) | Database: | MySQL 5.5 |
| CPU: | Intel Xeon E5-2666 v3 (Haswell) | Operating system: | Ubuntu 16.04 LTS |
| CPU cores: | 8 | ||
| Memory: | 32 GB | ||
| Disk: | Jira Service Management Server: Jira Service Management Data Center: | ||
| Load generator | |||
|---|---|---|---|
| Hardware | Software | ||
| EC2 type: | c4.8xlarge (see EC2 types ) | Operating system: | Ubuntu 16.04 LTS |
| CPU: | Intel Xeon E5-2666 v3 (Haswell) | Browser: | Headless Chrome |
| CPU cores: | 36 | Automation script: |
|
| Memory: | 60 GB | ||
| Disk: | AWS EBS 30 GB gp2 | ||