Jira Service Management 5.1.x release notes
21 July 2022
We're excited to present Jira Service Management 5.1.
Highlights
- Email channels audit log
- Insight accessibility and uplift
- Better PSMQ information logging
- Exclude events from the audit log
- Improved indexing management at Jira start-up
- Diagnose and troubleshoot Jira on the fly with Java Flight Recorder
- Prioritized search results in the issue navigator
- Keep your site running like clockwork with app monitoring
- Resolved issues

More
Read the upgrade notes for important details about this release and see the full list of issues resolved.
Compatible applications
If you're looking for compatible Jira applications, look no further:
Email channels audit log
Stay on top of your email channels with the new audit log. You can now easily check if the connection with your email channels is active and make sure all incoming emails are being processed correctly. The audit log consist of two different tabs:
A processing log that shows every message received from the connected email account. It allows you to search and filter to find specific emails.
A connectivity log. Jira Service Management attempts to connect to and pull new messages from your email channel every 60 seconds. The connectivity log shows the history of the results of each attempt.
Insight accessibility and uplift
Continuing with the Insight accessibility and improvements, in this release we’ve fixed:
color contrast issues
object schema view issues
issues with the graph component across various views.
Better PSMQ information logging
We’ve improved the information logging process that helps the support team troubleshoot PSMQ-related issues. Some of the improvements include:
Added missing information in logs about the message processing time and the total wait time for a message in the queue.
PSMQ queues message counts are outputted every minute in logs if Debug trace is enabled.
The current Queue configuration is available via the configuration page.
What do I need to know?
More information is shown at the Trace level than the Debug level.
The PSMQ queues message counts information displayed in the logs is fetched from the MESSAGE_COUNT column in the queue table which can be different than the actual messages in the MESSAGES table. We did this to avoid overloading the database.
The following features live in the Jira platform, which means they’re available for the whole Jira family—Jira Core, Jira Software, and Jira Service Management.
Exclude events from the audit log DATA CENTER
We've added new functionality that allows excluding some audit events from being recorded in the log. The new feature is available for admins on the Audit log settings page under the System support section (in the left-side panel):
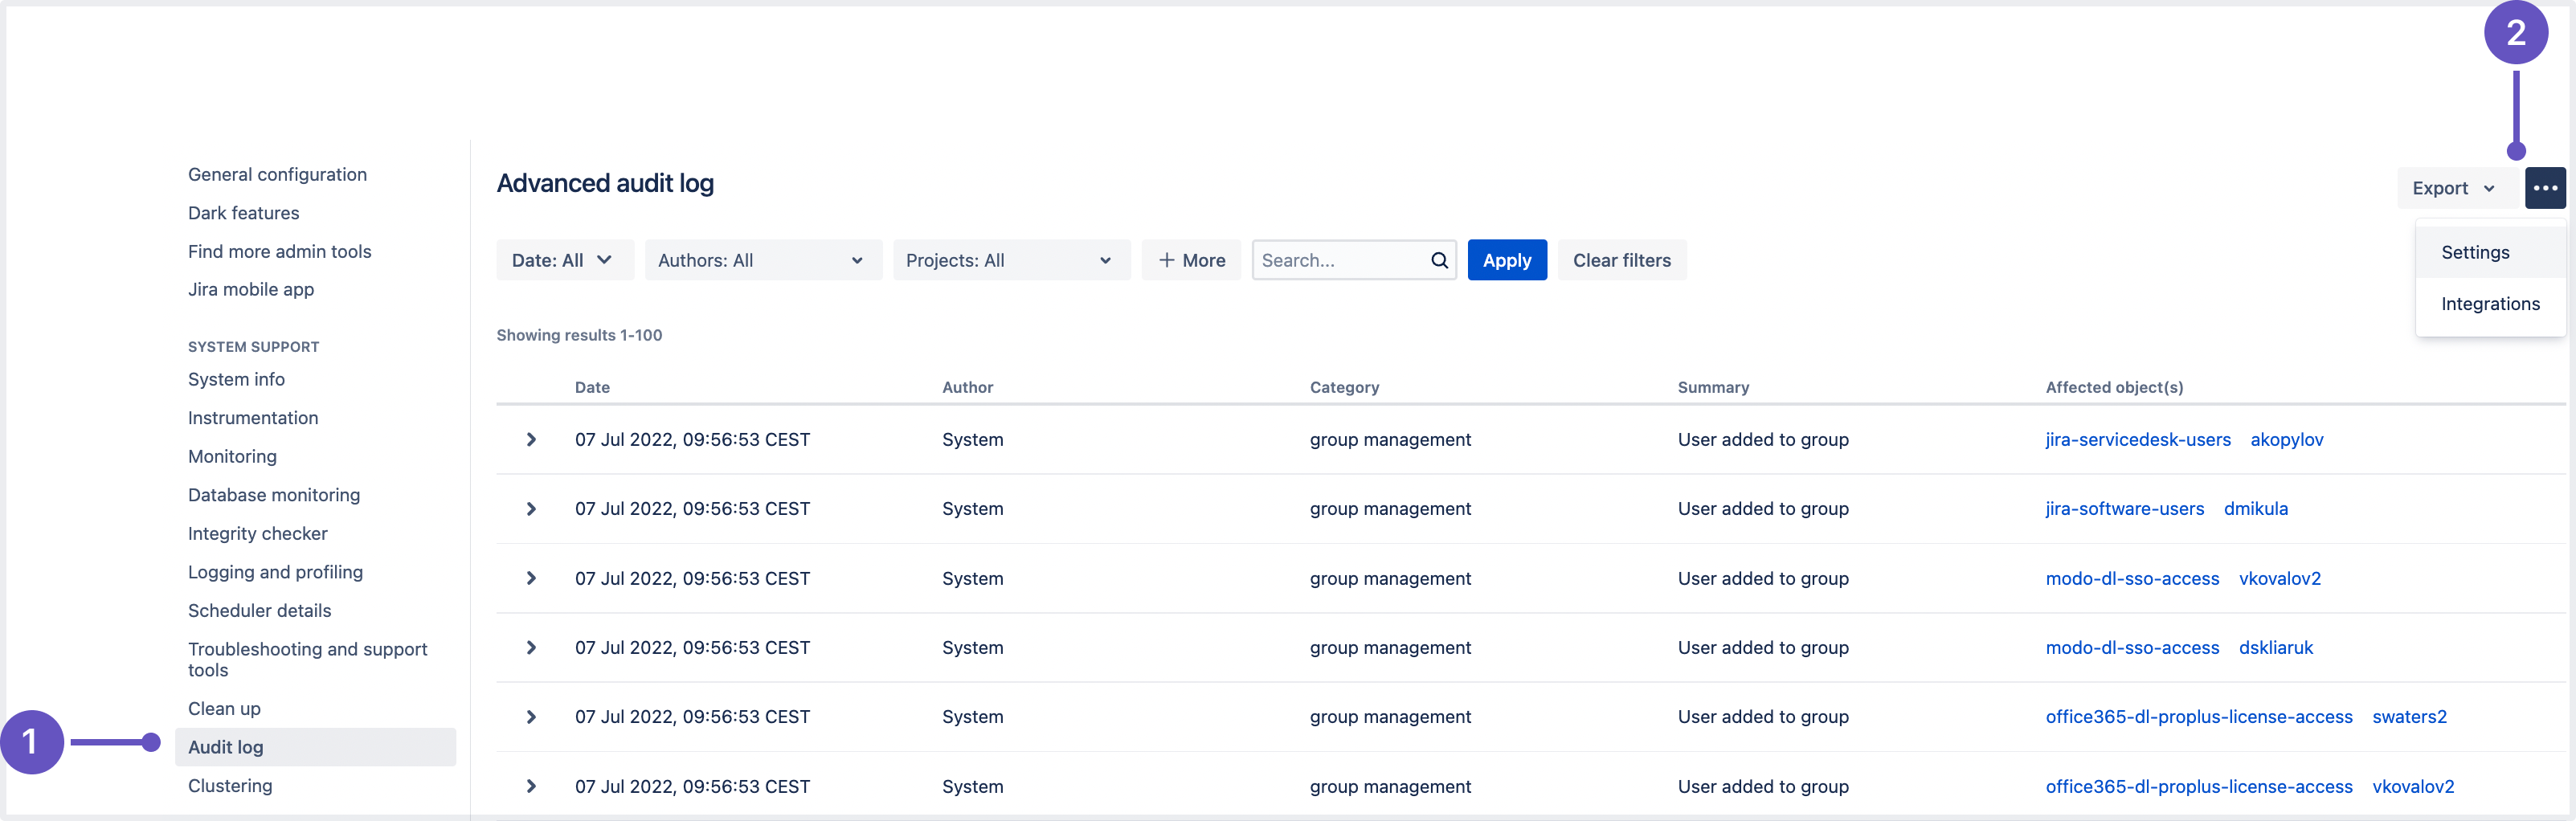
Audit log: Here, you can view all events recorded in the log.
Settings: A tab where all the audit log settings are configured.
You can view and add the events by scrolling down to the bottom of the page:
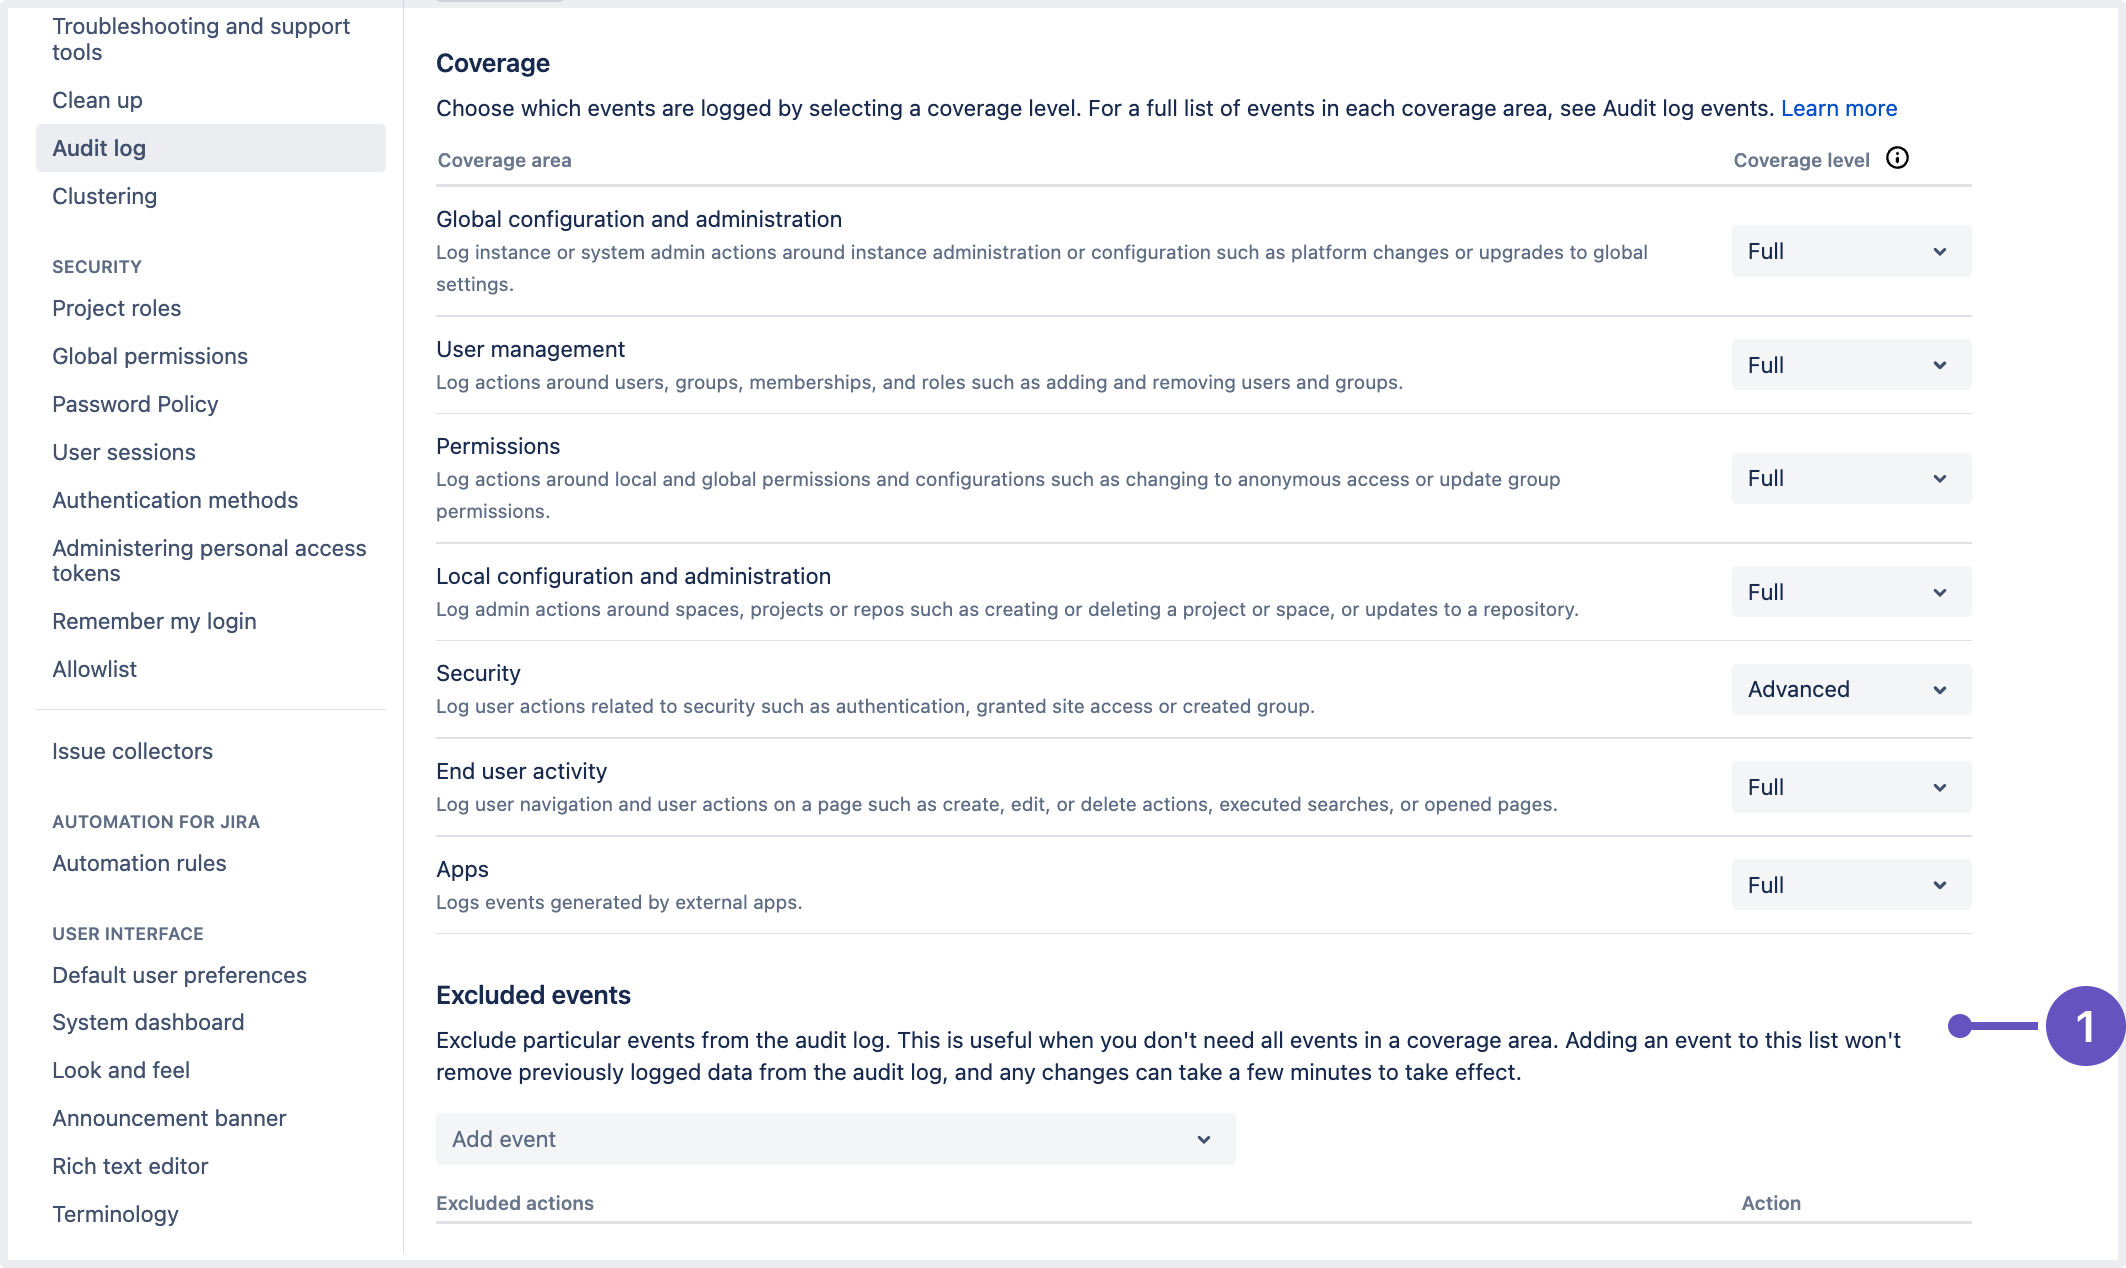
Excluded events: This is where admins can block events from being recorded.
Improved indexing management at Jira start-up DATA CENTER
With every new release, we’re aiming to improve Jira’s performance to power your productivity in the application. As more and more users rely on Jira and its scaling capabilities, ensuring better performance at increased scale becomes crucial.
In Jira 9.1, we’ve made the start-up procedure much more resilient. Now, when you’re starting multiple nodes, Jira will ensure that each of them ends up with a healthy index. If you’d like to know more about the changes, check out Index management on Jira start-up | Jira | Atlassian Documentation.
Diagnose and troubleshoot Jira on the fly with Java Flight Recorder
Accurately diagnosing and troubleshooting problems with Java apps can be a tough task that requires digging through gigabytes of logs to figure out what exactly went wrong. Jira 9.1 supercharges your ability to identify and resolve problems as they occur by bundling Jira with the Java Flight Recorder, a lightweight diagnostic tool for analyzing and troubleshooting apps at runtime.
As the Java Flight Recorder is bundled with Jira 9.1, you no longer need to upgrade Atlassian Troubleshooting and Support Tools yourself to start collecting runtime data — continuous runtime data recording is now done automatically.
To learn more about the feature:
Find out how to diagnose runtime issues using the Java Flight Recorder
Check out Jira Software 9.0.x release notes
Additionally, if you’d like to have a go at resolving the issue yourself or just take a look at what’s been collected, use the JDK Mission Control app to see everything at a glance.
Prioritized search results in the issue navigator
To address the problem of searching through too many custom fields for those users who have plenty of fields in Jira, we’ve added a results prioritization feature in the Columns dropdown of the Issue search view in the List mode.

Now, even when a searched query matches multiple fields, the exact matches will be displayed first. So, it will be easier for you to find and select the needed field, even with the limitation to the displayed number of results.
Keep your site running like clockwork with app monitoring
Keeping a big, busy site running smoothly requires a well-thought-out monitoring strategy. Many of you already use JMX to monitor things such as memory usage and CPU utilization. Now you can turn on application monitoring to get an even more granular view from the new app-specific metrics.

The monitoring screen allows you to turn JMX and app monitoring on or off as needed.
Learn how to monitor application performance
Diagnose performance problems
Investigating the cause of performance issues can be tricky, especially if you have many Marketplace or custom-built apps. It can be hard to know if the problem is the application, an installed app, or a misconfigured integration.
App-specific metrics include the plugin key, to give you a clearer picture of exactly what your apps are doing. This helps you rule out or pinpoint the source of a problem faster.
Spot issues before they happen
One of the biggest benefits of monitoring is the ability to be alerted to potential problems before they happen. We know from our own monitoring of huge Jira sites that identifying problems early is essential to maintaining uptime and a good user experience.
Some of the things you can now monitor include how long it's taking to render web panels, perform database operations, indexing, and more.
See the full list of app metrics and suggested alerts
Performance monitoring dashboards to get you started
If you don't currently have any monitoring, now is a great time to consider it. We've created some Grafana templates that you can use out-of-the box, or as a jumping-off point, to build your own dashboards.

Grafana dashboards to get you started with monitoring
Learn how to monitor Jira with Prometheus and Grafana
Resolved issues
Issues resolved in 5.1.0
Released on 21 July 2022
Issues resolved in 5.1.1
Released on 23 August 2022