Monitor application performance
App monitoring can give you a deeper insight into which apps are doing what in your instance. This can be useful when troubleshooting issues with a specific app, or to help you determine whether an app may have contributed to a drop in overall performance or stability.
Set up monitoring
Before you can connect your APM to Jira, you need to:
configure a JMX exporter, and
make sure that JMX and App metrics are enabled in your site.
The instructions on this page assume you’ll be using Prometheus. You can use any Application Performance Monitoring (APM) solution, the steps will be very similar for each.
1. Configure the JMX Exporter
The exporter takes the JMX MBeans and transforms them into the right format for Prometheus. It also hosts a HTTP endpoint which Prometheus will connect to. Learn more about the Prometheus JMX exporter.
If you don't plan to use Prometheus, you'll need to check which exporter or agent is required for your APM solution. For example, this Java agent for NewRelic.
To install the exporter:
Download the Prometheus JMX exporter jar file from the GitHub repository.
$ curl -L https://repo1.maven.org/maven2/io/prometheus/jmx/jmx_prometheus_javaagent/0.16.1/jmx_prometheus_javaagent-0.16.1.jar > jmx-exporter.jarCreate a configuration file for the exporter. You can download an example file from our repository. For more information on the configuration options see the
README.md.Copy the jar file and configuration file to each node (the local home directory is a good option).
Stop Jira on one node.
Add the following system properties to tell Jira where to find the JMX exporter. See Setting properties and options on startup to check how to do this for your site.
-javaagent:<full-path-to-jmx-exporter-jar>=<port>:<full-path-to-jmx-exporter-config.yml>The JMX exporter defaults to port 8080. You’ll need to specify a different port for the exporter if this port is in use by Jira or Data Center application.
Start Jira.
To check that the exporter is working, go to
localhost:<jmx-exporter-port>. You should see the metrics output.
Repeat these steps for all remaining nodes, if you run Jira in a cluster. You can perform a rolling restart to avoid any downtime.
You'll need to make sure the JMX exporter endpoint is not exposed outside your network, or that you've taken appropriate steps to secure it.
2. Enable application monitoring in Jira
App monitoring uses JMX (Java Management Extensions), so JMX monitoring must also be enabled. Both JMX and App monitoring are enabled by default, but may have been disabled by an administrator.
To turn on app monitoring:
Go to
 > System > Monitoring.
Check that JMX monitoring is enabled.
Check that App monitoring is enabled.
If you have previously set up JMX monitoring for Jira, there’s nothing else you need to do. The additional app monitoring metrics will be exposed in the same way as existing application metrics. For the full list of things, you might want to monitor see Application metrics reference.
If you don’t have an existing Application Performance Monitoring (APM) solution, see our guide on getting started with Prometheus and Grafana.
JMX monitoring can have a performance impact on your site. In most cases it’s not significant. However if you do experience any problems with your instance performance or stability, you can disable both JMX and app monitoring.
Disable app monitoring
To disable app monitoring:
Go to
> Monitoring.Disable App monitoring.
Once disabled, Jira will no longer emit app-specific metrics, or write them to logs. If you want to disable JMX altogether, you can also disable JMX monitoring.
Identify the app name
App metrics include the plugin key rather that the app's display name. For example, com.atlassian.troubleshooting.plugin-jira is the plugin key for the Troubleshooting and Support Tools system app for Jira.
To find the app name:
Go to
<base-url>/plugins/servlet/upm/osgiEnter the plugin key in the Search bundled metadata field
The plugin details will be returned, including the name and vendor.
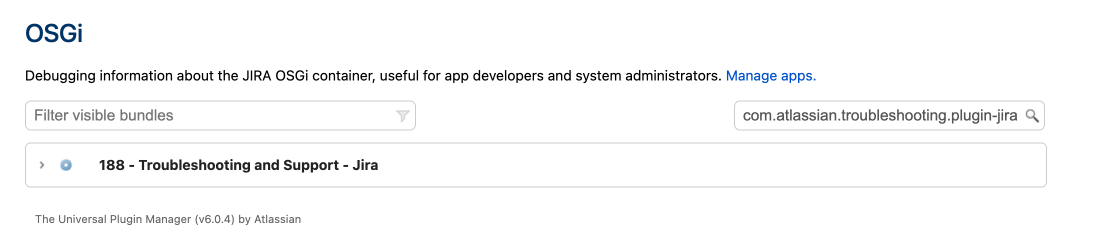
OSGi admin screen showing search results for a plugin key
You can also use the following REST endpoint /rest/plugins/1.0/<plugin-key>/summary which returns all the details about the app.
Enable optional tags
App vendors can choose to include additional metadata which can help when troubleshooting a performance issues. These tags are not included by default.
You can use the atlassian.metrics.optional.tags system property to show additional tags for a metric.
atlassian.metrics.optional.tags.<metric-name>=<tag-key1>,<tag-key2>For example, if the full metric name is sampleApp.asset.loadtime and the app vendor included a tag to output additional information about the content type.
atlassian.metrics.optional.tags.sampleApp.asset.loadtime=sampleApp-typeThe app vendor will be able to tell you the exact metric and tag names.
Troubleshooting
Out of memory errors
Because the monitoring is happening outside your application, we don’t expect there to be a significant impact on your instance performance or stability. If you do experience problems, you can disable JMX and app monitoring.
In the event of out of memory errors (OOME) caused by the monitoring agent, increase the JVM_MINIMUM_MEMORY(-xmx) in the setenv file. See Increasing Jira application memory
App monitoring early access preview
If you participated in our early access program, you must remove the EAP monitoring agent and associated system properties before you upgrade, or Jira may fail to start or encounter problems.