Burndown Chart
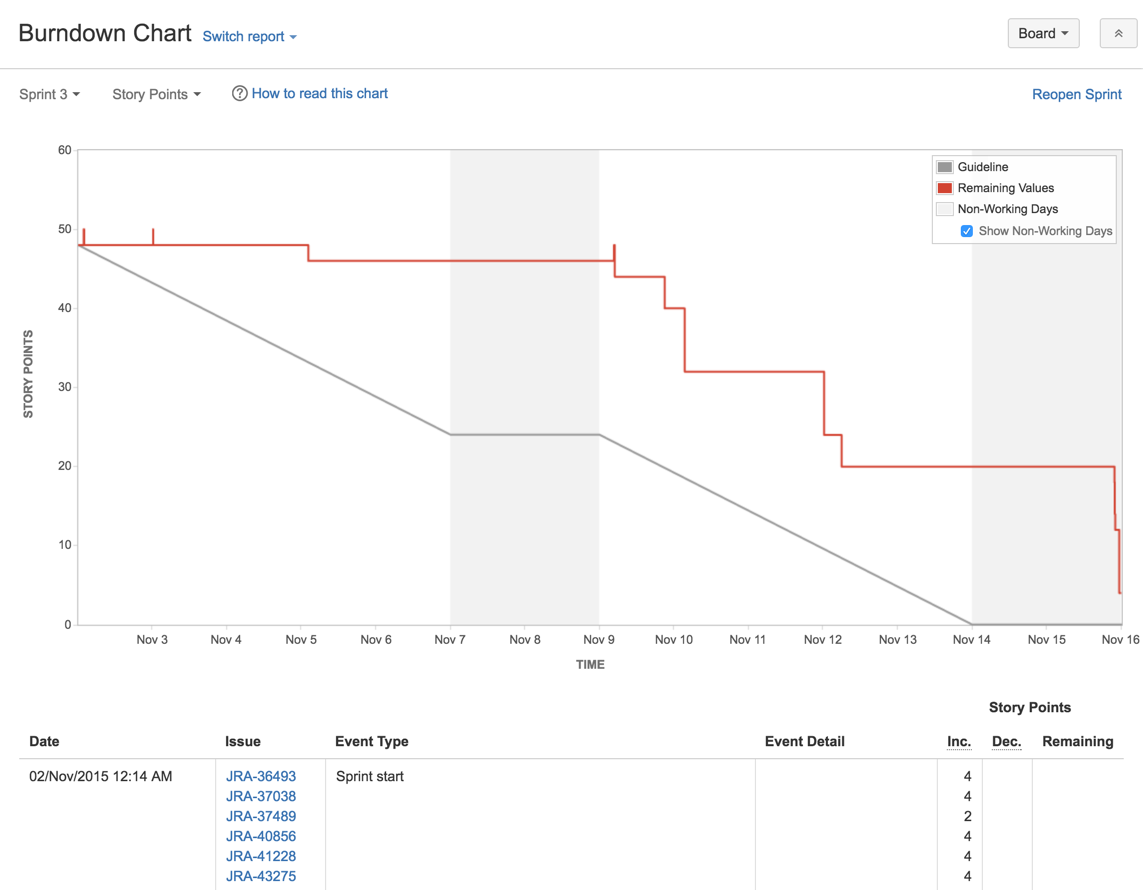
Screenshot: Burndown Chart
A Burndown Chart shows the actual and estimated amount of work to be done in a sprint. The horizontal x-axis in a Burndown Chart indicates time, and the vertical y-axis indicates cards (issues).
Use a Burndown Chart to track the total work remaining, and to project the likelihood of achieving the sprint goal. By tracking the remaining work throughout the iteration, a team can manage its progress, and respond to trends accordingly. For example, if the Burndown Chart shows that the team may not likely reach the sprint goal, then the team can take the necessary actions to stay on track.
Before you begin
- The Burndown Chart only applies to Scrum boards.
Viewing the Burndown Chart
- Navigate to your desired board.
- Click Reports, then select Burndown Chart.
- To choose a different sprint, click the sprint drop-down.
- To choose a different estimate statistic, click the estimation statistic drop-down. This change will be saved for you, for when you next visit this chart.
Understanding the Burndown Chart
Before you start using the Burndown Chart, you should get to know how it works. The following information will help you understand the key functionalities of the Burndown Chart:
- The Burndown Chart is board-specific – that is, it will only include issues that match your board's saved filter.
- The vertical axis represents the estimation statistic that you have configured for your board.
- The Burndown Chart is based on your board's column mapping. An issue is considered to be 'To Do' when it is in a status that has been mapped to the left-most column of your board. Similarly, an issue is considered to be 'Done' when it is in a status that has been mapped to the right-most column of your board. See Configuring columns for more information.
- If the grey 'Guideline' line does not show, the sprint may have been started before any issues were assigned to it, as described in this KB article.
Next steps
Need help? If you can't find the answer you're looking for in our documentation, we have other resources available to help you. Check out Getting help.
Read the following related topics:
