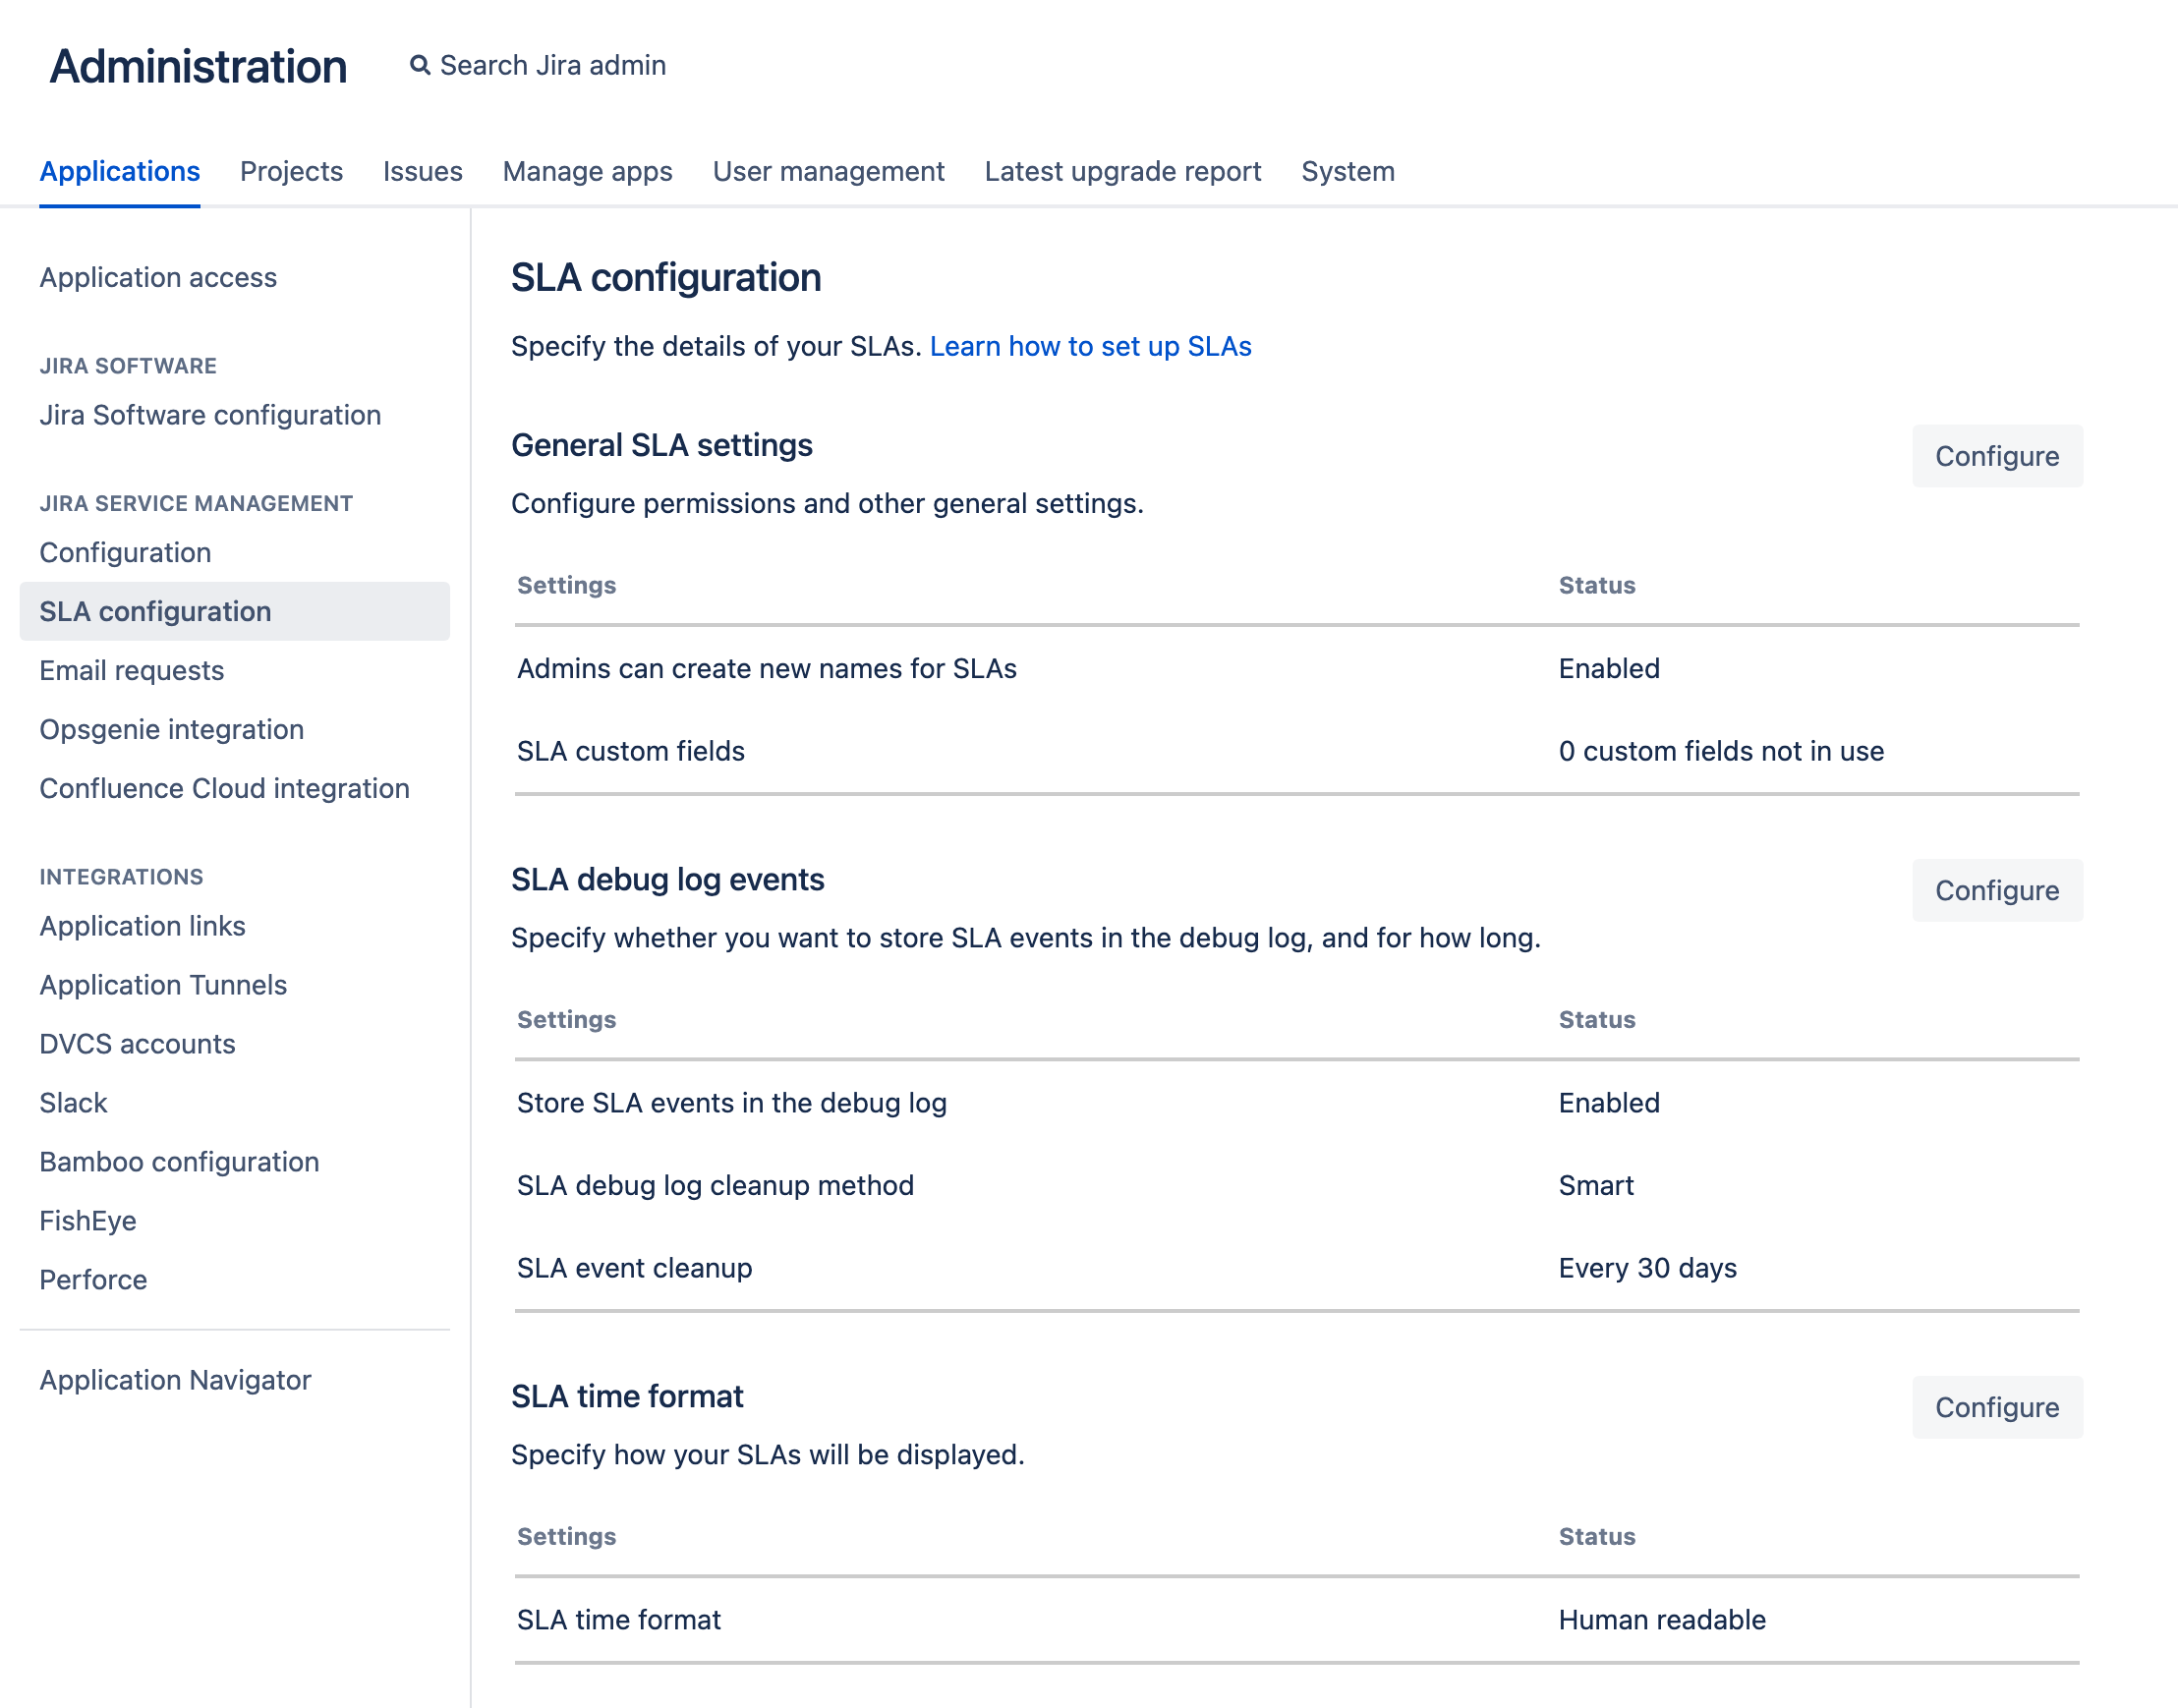
Configure additional SLA settings
Jira administrators can configure the following additional SLA settings :
- Allow project admins to create new names for SLAs
- Choose how time formats are displayed.
- Specify how debug log events are handled.
Navigate to Administration > Applications > SLA configuration and select Configure against the setting you wish to modify.
Clean up SLA debug log events
Whenever a Jira Service Management issue event is triggered or an SLA is created or deleted, Jira Service Management updates the corresponding SLAs. The SLA debug log feature creates an entry in the database (AO_54307E_SLAAUDITLOG and AO_54307E_SLAAUDITLOGDATA tables) to reflect that change.
As a Jira administrator, you can decide how you want the SLA debug log to be cleaned up. You can also select how often the events will be deleted from the database.
Configure thread processing
To increase the performance of Jira Service Management, we run SLA calculations in background tasks. A thread, in this context, executes those tasks, in parallel with other threads.
You can configure the processing method as well as the thread count for your SLA calculations.
Processing method | Description |
|---|---|
Multi-threaded serialized processing (Number of threads is configurable) | We recommend using this processing method. Introduced in version 4.21.0, this new processing method is self-healing, more cluster-efficient, and more reliable, specifically when Jira is running in a multi-node cluster mode. This method allows any Jira node to process any of the stored events. Unlike the in-memory processing mode, application restarts don't affect SLA processing with this method. Even if you only have one node in your cluster, SLA calculations will resume from the place they were interrupted should any interruption happen. It uses historical event data stored in the database to calculate SLAs in the order the events arrived for an issue. The thread pool in this method is configurable in the range of 1-20 threads. |
Multi-threaded in-memory processing (Number of threads is configurable) | This method is considered a legacy processing mode. The thread pool here is configurable in the same way as in the serialized processing method—in the range of 1-20 threads. In this mode, all processed events are bound to the node they had happened on. When the application stops on one node, all unprocessed events are lost, and not included in the SLA history until it's manually reconstructed (for versions before 5.0) or until another event happens on the same issue (from version 5.0). |
No background processing (Number of threads isn't configurable) | In this method, all processing is done in the request thread, locking the response (user feedback) until the SLA calculation is finished. If you select this processing mode, you might experience significant decrease in the perceived performance of actions like issue creation, comment creation, or issue transition. |
SLA calculations result in querying the database to fetch information. Our databases use connection pools to limit simultaneous active connections to it. In case of no background processing, we don’t control the pool count as it works on HTTP threads. This may lead to a fast database connection pool exhaustion under load. Learn more about database connections
Configure the SLA thread count
If you select the multi-threaded serialized or the multi-threaded in-memory processing method, you can configure the thread pool count for your SLA calculations in the range of 1-20. Thread count values are synchronized across all nodes without restarting the processors.
The default number of SLA threads per node is set to 5. However, in case the SLA calculations aren’t keeping up with issue updates, we suggest using the recommended multi-threaded serialized processing method and bumping up the SLA thread count in small increments while observing the system response.
