Assess your instance scale using Jira Cloud Migration Assistant: Database queries and usage metrics
You can assess the cloud readiness of your Jira Data Center instance by collecting data about its content, such as the number of users, projects, custom fields, and many more.
How it works
The cloud readiness of your Data Center instance will be assessed by comparing your data with Atlassian guardrails relevant for migrations or your future setup in cloud.
How you’ll collect, share, and view your data can be done in one of the following ways:
OPTION 1 Using Portfolio insights RECOMMENDED
You’ll use Portfolio insights to connect to Data Center and collect the data (with a fallback manual collection possible). Your cloud readiness report will be generated instantly.
Your raw data will be available to Atlassian migration teams who can provide additional information, if needed.
OPTION 2 Sharing raw data with Atlassian
You’ll run the assessment from the migration assistant and attach results to your MOVE ticket. Migration teams will prepare a cloud readiness report and share it with you. Use this option only when recommended by Atlassian migration teams.
![]() Use for Atlassian Government Cloud migrations.
Use for Atlassian Government Cloud migrations.
![]()
Collected data
In both options, the report is prepared based on the data collected through the migration assistant. Here’s a summary of what we collect:
Jira entities: Number, or metadata, of entities, such as projects or issues
Usage data: for example the number of active users in the past days
Instance metadata: products installed, details about the database, Data Center nodes, and some metadata related to your instance, such as Server ID or timezone
Browser metrics: performance and browser metrics, including network speed and quality, based on users' browser
Apps: number and size of entities that might affect the migration, for the most critical apps
Once collected, the data is saved in a ZIP archive and either transferred or uploaded to Portfolio insights or attached by you to your MOVE migration ticket.
For more details, see What data is collected
Not all collected data is analyzed and used in your report.
How we use the data
We’ll only collect and use the metadata about your Jira instance. This metadata doesn’t contain any Personally Identifiable Information (PII) or user-generated content (UGC). It’s based only on IDs.
This will help us better understand your data complexity and cloud performance needs, and will allow us to craft a migration strategy and plan that mitigates risk and sets you up for success. Additionally, the metadata collected will help us continually improve our products and tooling.
FAQs
Here are some common questions.
Before you begin
Here are some prerequisites:
We add new data points on a regular basis. To get the most accurate results, update Jira Cloud Migration Assistant to the latest version.
The assessment duration depends on your data. On average it takes up to a few hours, but should be much faster for less complex instances.
OPTION 1
Using Portfolio insights RECOMMENDED
In this option, you’ll connect to your Data Center instance from Portfolio insights to collect the results, and then view your cloud readiness report.
1. Go to Portfolio insights
You can access Portfolio insights by going to admin.atlassian.com, and selecting Settings > Portfolio insights. Check the following page for detailed instructions.
Get started with Portfolio insights
2. Connect to your Data Center instance
To connect to a Data Center instance, you’ll need to meet some requirements like installing the Cloud Companion app and allowlisting the https://api.atlassian.com domain.
How to connect to Data Center instances
3. (Fallback) Manually collect and upload data
If you’re unable to connect to your Data Center instance, you can manually run the assessment and upload the results to Portfolio insights.
How to manually collect and upload data
4. View your cloud readiness report
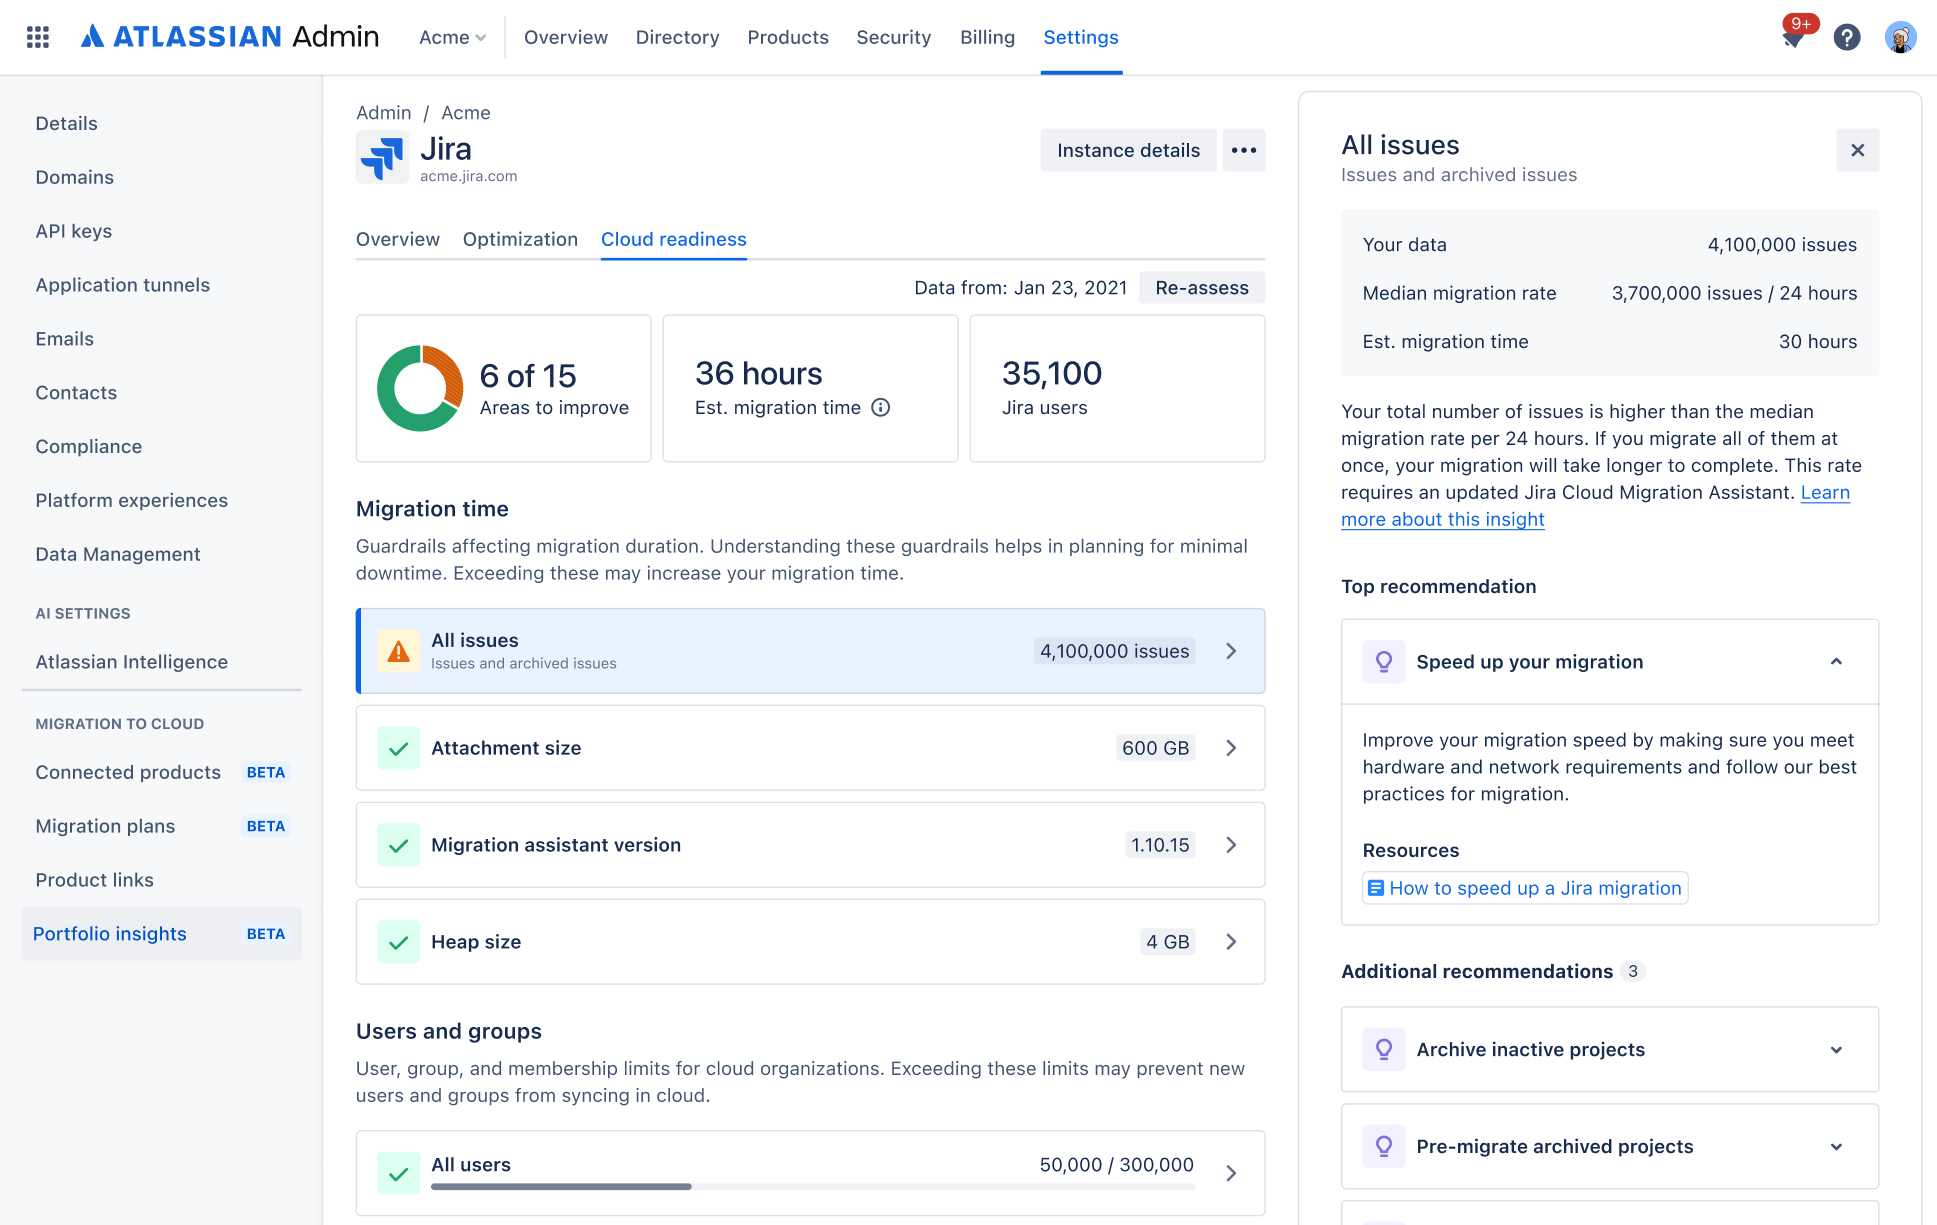
Once the data is collected and transferred/uploaded to Portfolio insights, you’ll be able to view your cloud readiness report, with insights into your data and recommendations on how to fix or improve it.
How to view your cloud readiness report
OPTION 2
Sharing raw data with Atlassian
In this option, you’ll manually run the assessment from the migration assistant. When it’s ready, you’ll download a ZIP archive and share it with Atlassian by attaching it to your MOVE ticket.
What data is collected
Details of files included in the ZIP archive and examples of collected data points.
File | Description |
|---|---|
| Data about specific entities, retrieved from the database. It helps us understand the scale of your instance. |
| Usage metrics taken from access logs. It helps the Jira Cloud teams determine the best cloud instances for you. |
| Details about your instance, including products, infrastructure, database, Data Center nodes, and some metadata for easier identification. |
| Data from users' browsers on the performance of your instance. It helps us understand what you’ll need in cloud for best performance. |
| Data about entities that might affect the migration, for the most critical apps. If you have these apps, each will have a separate file inside. |
| (Deprecated) This file includes data about specific entities, similarly to |
Details of metrics included in the files
More details about the data points and metrics included in the files.
File: jira-entities-[date].csv
This file includes the following metrics:
File: jira-usage-metrics-[date].csv
Interactions date: Date when an interaction with the Jira instance was recorded in the access logs.
Active users per day: Total number of unique users who interacted with the Jira instance in the past 14 days.
Peak-hour active users per day: Number of unique users who interacted with the Jira instance at the same time. We obtain it by aggregating user IDs and the corresponding date-hour combinations in the access logs. It provides a snapshot of your instance’s busiest periods.
Node availability and data collection status: Data on the availability of each node (or single node). It also shows the status of data collection.
File: jira-instance-metadata-[date].jsonl
Products: Name, version, and SEN number of products installed on your instance.
- Infrastructure: Details about the database, Data Center nodes, and Java heap size.
- Instance metadata: Some metadata, including assistant version, Server ID, instance UUID, and timezone.
File: jira-browser-metrics-[date].jsonl
user ID: A unique identifier of a user. It’s generated securely and hashed randomly to maintain privacy, while also allowing us to track user interactions.
Browser type and version: Details about the browser, for example Google Chrome, Safari.
Operating system: Details about the operating system, for example Windows, MacOS.
Processor count: Number of processors on the device.
System memory (RAM): Total memory or RAM on the device.
Network download speed: The speed of downloading data.
Network connection quality: The effectiveness of network connection.
Network Latency (RTT): Round Trip Time (RTT) is a measurement of the time it takes for a signal to travel from a user's computer to the Jira Instance and back. This helps gauge the responsiveness of users' network connection.
File: cloud-scale-database-[date].csv
This file has been deprecated and will be removed in one of the upcoming versions. It includes data about some entities that you can also find in the jira-entities-[date].csv file.
Apps subdirectory
This subdirectory contains files with entities for the most critical apps.
File: user-installed-apps-[date].jsonl
File: zephyr-squad-[date].jsonl
File: xray-[date].jsonl
File: scriptrunner-for-jira-[date].jsonl
File: jira-misc-custom-fields-[date].jsonl
File: jsu-automation-suite-[date].jsonl