Grouping by teams
When you group issues by teams, issues will display in team-specific swimlanes. The teams in the plan have their own swimlanes and you can view its assigned issues by expanding each team.
If you've associated the teams in your plan to corresponding issue sources, you can also show the overall capacity of these teams in the timeline. This can help you visualize how team-specific work is distributed across multiple sprints.
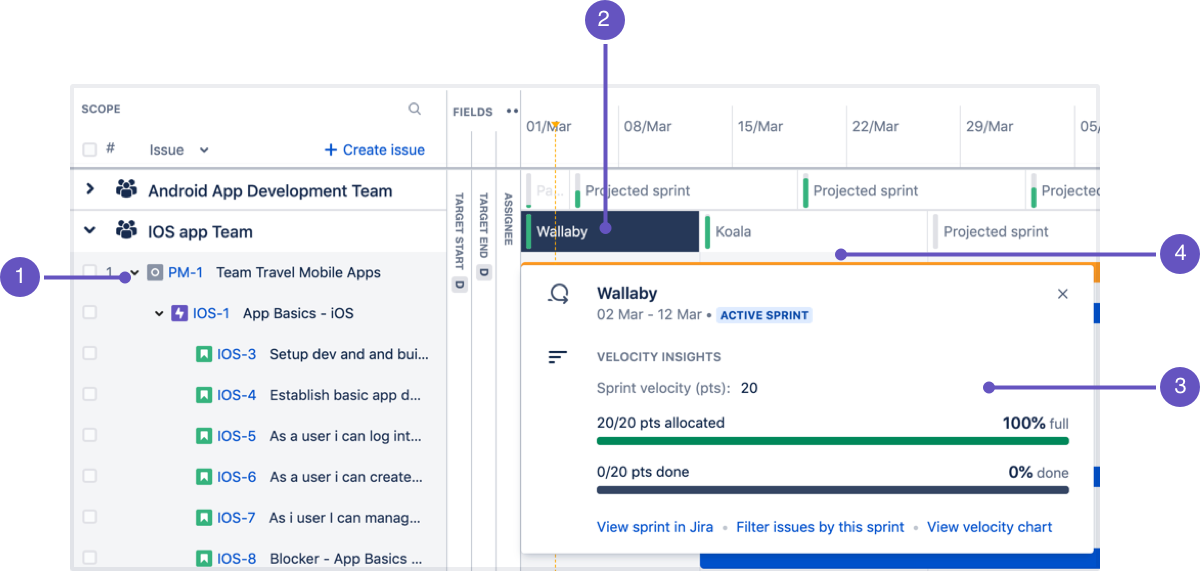
- One of the initiative issues that's assigned to the IOS app team in the plan.
- The currently active sprint that's assigned to the IOS app team.
- Click the capacity bar of a sprint to view the capacity details of that sprint. See Showing capacity in the timeline for more information.
- Other sprints belonging to the team, including the ones that have already been created in Jira, and the ones allocated as future sprints in the timeline.
To group issues by teams:
- In the roadmap view of the plan, click View settings.
- From the 'Group by' menu, choose Team. The issues in the plan will be grouped into team-specific swimlanes, with the team groupings sorted alphabetically.
- To display the sprints associated to teams in the plan, click the Show capacity on timeline checkbox.
Notes on showing sprints and capacity in a plan:
- All the sprints associated with a team will appear in the timeline, which means your timeline might be filled with a lot of sprints, and might end up too crowded. To handle this, consider viewing issues for just a specific timeframe.
- When a sprint is completed, the sprint will be visualized on the timeline as finishing at the end of the day before it was completed. Effectively, this prevents sprints from appearing to overlap on the timeline. This visualization applies whether your issues are scheduled through sprint assignment, or you're manually scheduling the issues themselves.
- If your teams are working on parallel sprints in Jira, these sprints will appear independently in the timeline.
Showing capacity in the timeline
Showing the overall capacity of your teams in the timeline helps you visualize how team-specific work is distributed across multiple sprints or iterations. It also helps you determine if too much work has been scheduled for a sprint or iteration.
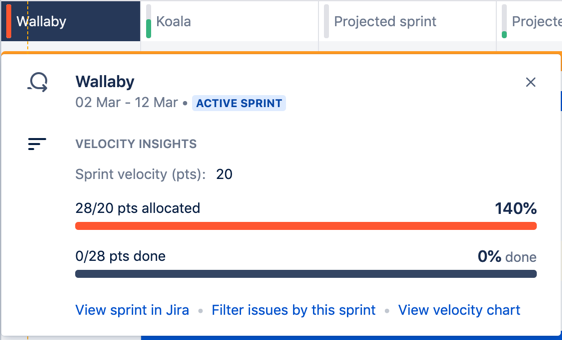
Sample of an overbooked sprint
In the example above, the Wallaby sprint is showing a red capacity bar, which means too much work has been allocated to that sprint. You can quickly fix this up by removing some issues from that sprint, or adding more people to the team.
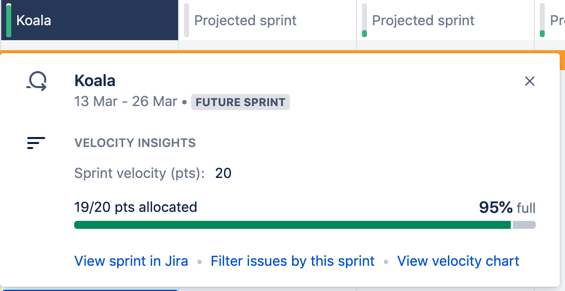
Sample of a healthy sprint
Clicking the capacity bar of a sprint will display the following:
- sprint name
- sprint start and end dates
- status of the sprint (for example, active or future sprint)
- sprint goal (if added in Jira)
- sprint velocity
- percentage of how full the sprint is in estimated story points
- percentage of issues that have been completed (if sprint is active)
Understanding capacity details in Scrum and Kanban
For both Scrum and Kanban teams, the capacity bars reflect how work is evenly distributed across the corresponding duration (sprints for Scrum, iterations for Kanban). This is the basic premise on how work is distributed in the current plans.
There are some differences to note about how bars reflect capacity details however.
For Scrum teams:
- When using story point estimates, velocity is measured against the sprint duration. If velocity is set to 30 story points for a 2-week sprint, the capacity details will show the percentage of how full the sprint is in terms of the estimated story points.
- When using time-based estimates, capacity is measured against the duration of a week. If weekly capacity is set to 200 hours for a 2-week sprint, the capacity details will show the percentage of how full the sprint is in terms of the estimated hours.
- Even if a story spans multiple sprints, its estimate will consume capacity from the sprint that's assigned to it. For instance, TIS-123 is scheduled for 20 days, and it spans sprints 1 and 2 because each sprint runs for 10 days. TIS-123 is assigned to sprint 1, so its estimate of 30 story points will be allocated to sprint 1.
For Kanban teams:
Capacity is measured against the duration of a week. If weekly capacity is set to 200 hours, then the capacity details will show the percentage of how full the iteration is in terms of the estimated hours.


