Monitoring progress of work
Monitoring the progress of your teams is equally important when planning work for them. By monitoring progress, you can quickly see any potential bottlenecks, and you can act on them so they don't end up happening.
There are several ways to monitor the progress of the work of your teams across your plans.
Using the progress bar
You can add the progress columns in your roadmap, to visualize the issues in your plan with the following status categories:
- TO DO for issues that are still in the To do status category
- IN PROGRESS for issues in the In progress status category
- DONE for issues in the Done status category
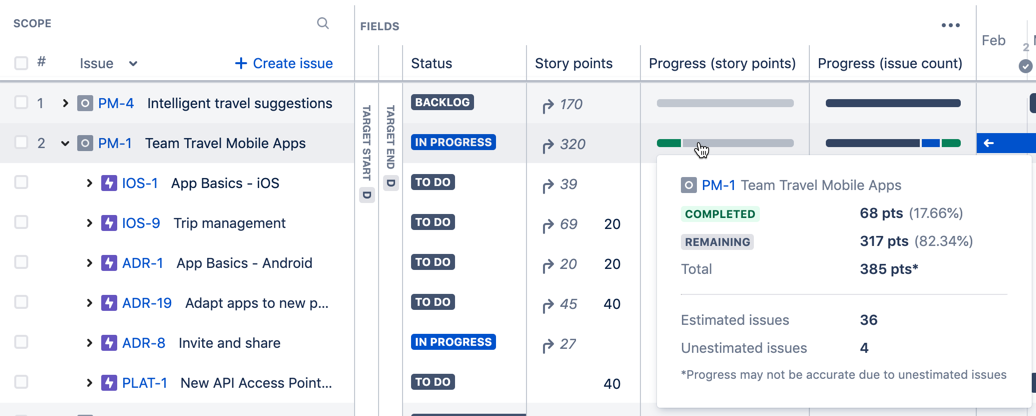
This sample plan is using hours to estimate issues, and the two progress columns are displaying progress in terms of estimated story points and number of issues.
How estimate-based progress works
If you hover on the progress bar of a parent issue, the breakdown of work will take into account the estimates of all descendant issues and the estimate of the issue itself. If the parent issue is unestimated, it will still have a progress bar, but only the aggregated estimates of the descendant issues will be considered.
In the example above, the progress details show the following:
- The progress bar is broken down into two colors that represent completed and remaining work:
- COMPLETED is the sum of the logged hours for all child issues in To do and In progress status categories, and the total time for any child issues in Done status category.
- REMAINING is the sum of the remaining hours for all child issues in To do and In progress status categories.
- The breakdown of estimated issues and unestimated issues will also be displayed. Note that progress may be inaccurate due to any unestimated issues.
- If you complete a parent issue, but its child issues are not yet completed, and have remaining hours logged against them, the remaining hours will not be added to the completed hours of the parent issue. The remaining hours will be calculated as remaining hours of the child issues.
- If you've enabled rolled-up values in a plan, the remaining estimates of Done child issues will roll up to their parent issues. This calculation is inconsistent with how completed and remaining estimates are calculated in the progress bar. This means that you may see inconsistent values between rolled-up estimates of a parent issue and the estimate values in the progress bar of the same parent issue.
- If you use days to estimate work in your plan, the progress details will be displayed in day units accordingly.
Any issues that are not saved to Jira will not be taken into account in calculating progress.
For issues without child issues, the percentage of completed work against remaining work will also be displayed.
How issue count progress works
If you hover on the progress bar of a parent issue, the breakdown of work will take into account the number of issues in the different status categories, the total number of issues in the plan, and the percentage of the number of issues in each status category against the total number of issues.
In the example above, the progress details show the following:
- The initiative PM-4 has two (2) child epics: PLAT-2 and WEB-23. The progress bar then covers a total of 2 issues.
- There is 1 issue that's still to do: WEB-23. Since there's a total of 2 issues, WEB-23 is 50% of the total issue count.
- There's also 1 issue that's already done: PLAT-2. This issue is also 50% of the total issue count.
- The estimates for each issue are not taken into account by the progress bar, since progress here only covers issue count.
Any issues that are not saved to Jira will not be taken into account in calculating progress.
Monitoring capacity
To monitor capacity in your plan, you first need to show capacity in the timeline of your plan. This is only possible if you group issues by teams and sprints.
Once capacity is displayed in your team, you can then visualize how team-specific work is distributed across multiple sprints. This helps you determine if too much work has been scheduled for a sprint, and helps you plan out how to distribute work in overbooked sprints.
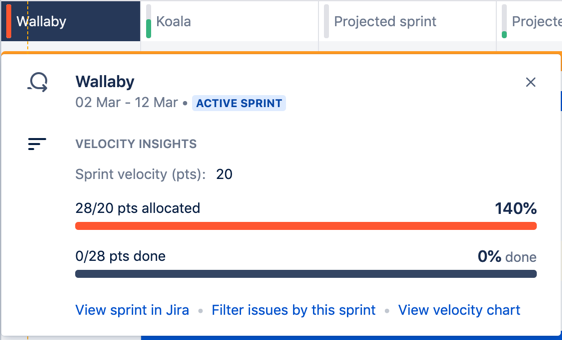
Sample of an overbooked sprint
In the example above, the Wallaby sprint is showing a red capacity bar, which means too much work has been allocated to that sprint. You can quickly fix this up by removing some issues from that sprint, or adding more people to the team.
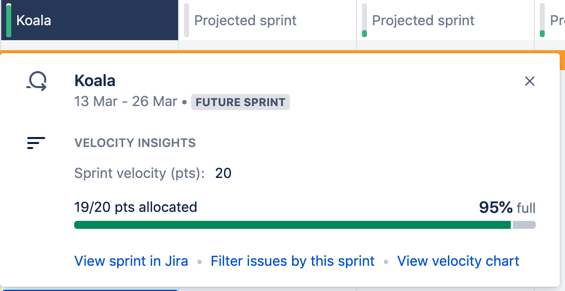
Sample of a healthy sprint
Clicking the capacity bar of a sprint will display the following:
- sprint name
- sprint start and end dates
- status of the sprint (for example, active or future sprint)
- sprint goal (if added in Jira)
- sprint velocity
- percentage of how full the sprint is in estimated story points
- percentage of issues that have been completed (if sprint is active)
Understanding capacity details in Scrum and Kanban
For both Scrum and Kanban teams, the capacity bars reflect how work is evenly distributed across the corresponding duration (sprints for Scrum, iterations for Kanban). This is the basic premise on how work is distributed in the current plans.
There are some differences to note about how bars reflect capacity details however.
For Scrum teams:
- When using story point estimates, velocity is measured against the sprint duration. If velocity is set to 30 story points for a 2-week sprint, the capacity details will show the percentage of how full the sprint is in terms of the estimated story points.
- When using time-based estimates, capacity is measured against the duration of a week. If weekly capacity is set to 200 hours for a 2-week sprint, the capacity details will show the percentage of how full the sprint is in terms of the estimated hours.
- Even if a story spans multiple sprints, its estimate will consume capacity from the sprint that's assigned to it. For instance, TIS-123 is scheduled for 20 days, and it spans sprints 1 and 2 because each sprint runs for 10 days. TIS-123 is assigned to sprint 1, so its estimate of 30 story points will be allocated to sprint 1.
For Kanban teams:
Capacity is measured against the duration of a week. If weekly capacity is set to 200 hours, then the capacity details will show the percentage of how full the iteration is in terms of the estimated hours.
Monitoring releases
From the releases view
You can jump to the releases view of your plan to grab a high-level view of how work is tracking. This will help you determine if your teams can realistically complete the work assigned to the releases in your plan.
Releases view with sample releases
In the example above, you can quickly see the how each release is tracking. As long as the start and end dates of the issues fall within the start and end dates of their corresponding releases, then the releases stay on track.
You can drill down on what's blocking this release by doing any of the following:
- View the release in the roadmap of the plan, to see if there are any blockers for the pending issues.
- For project releases, view the release in Jira, to see a condensed list of all the issues assigned to that release, and possibly to change the release dates as needed.
- Hover on the progress bar of a release, to check how many issues are still to be completed.
At the moment, the progress bar only includes the details of the issues that are currently visible in the plan. This means that old releases may not have accurate information.
From the timeline section
You can also track the progress of releases directly in the timeline section of a plan.
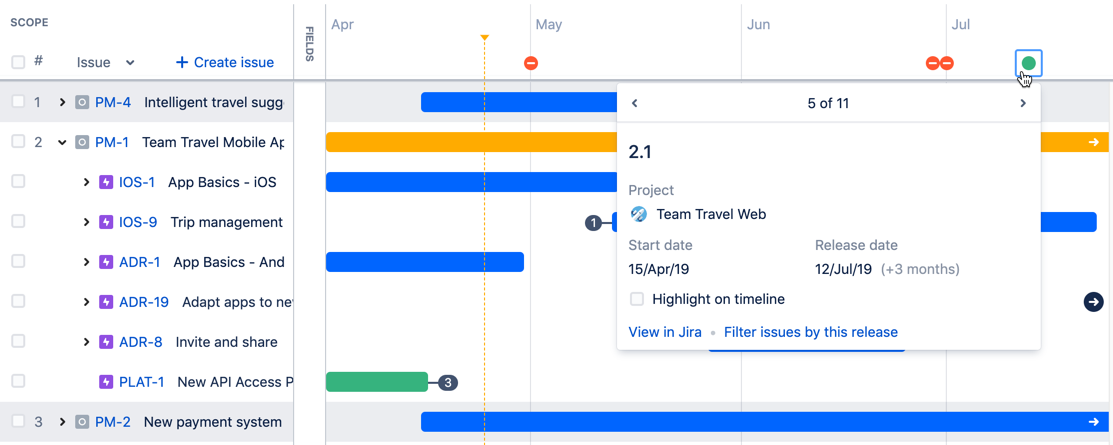
Sample plan with releases in the timeline
Green icons represent releases that are on track, while red ones are for releases that are off track. As long as the start and end dates of the issues fall within the start and end dates of their corresponding releases, then the releases stay on track. Click on an icon to view more details about the release, and more importantly, to determine how you can fix the state of off track releases.
The number of releases could accumulate over time, which can make it hard to navigate from one release to another on the timeline. There may be times when releases are only one day apart, or there may be multiple releases scheduled on the same day.
If this happens in your plan, try doing one of the following:
- Jumping from one release to another
- Viewing details of multiple releases
- Highlighting releases on the timeline
- Filtering issues by a release
- Filtering issues by projects
Jumping from one release to another
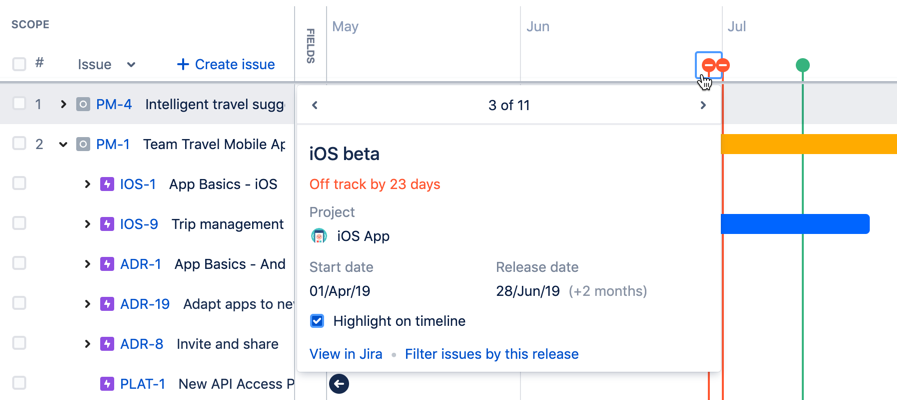
Click a release icon, and then click either the left arrow or the right arrow, to jump to the next release.
While jumping from one release to another, the details of each release will be displayed accordingly.
Sample multiple releases on the timeline
Viewing details of multiple releases
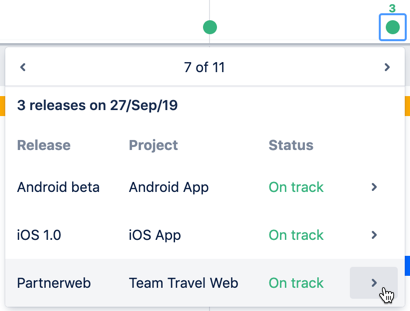
Occasionally, you may see a number above a release icon. In the sample release below, the number denotes that there are two releases scheduled on the same day.
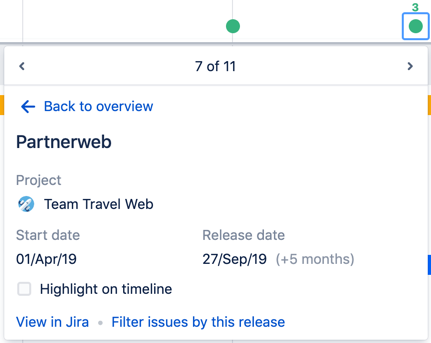
Click on the release icon to see the releases scheduled for that day, and then click the right arrow of each release to view more details about it.
Sample releases scheduled on the same day
Highlighting releases on the timeline
If there are any releases that you want to keep an eye on, you can highlight these releases on your timeline. This helps make any relevant releases stand out in your timeline.
Click the Highlight on timeline check box, and the release will be displayed with either a red or green line in the timeline.
Sample releases highlighted on the timeline
Filtering issues by a release
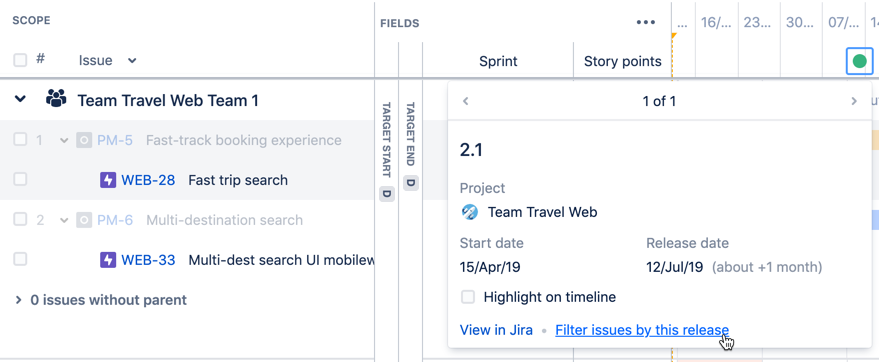
You can also filter issues by a release, which will display the corresponding issues filtered by sprint in the roadmap view.
Sample issues filtered by a release in the roadmap view
Filtering issues by projects
You can also filter issues by projects, which will display only the releases of the relevant projects. To further narrow down on the release details, consider filtering the issues by a single project.
Issues filtered by the IOS project, with releases filtered as well


