Auditing in Jira
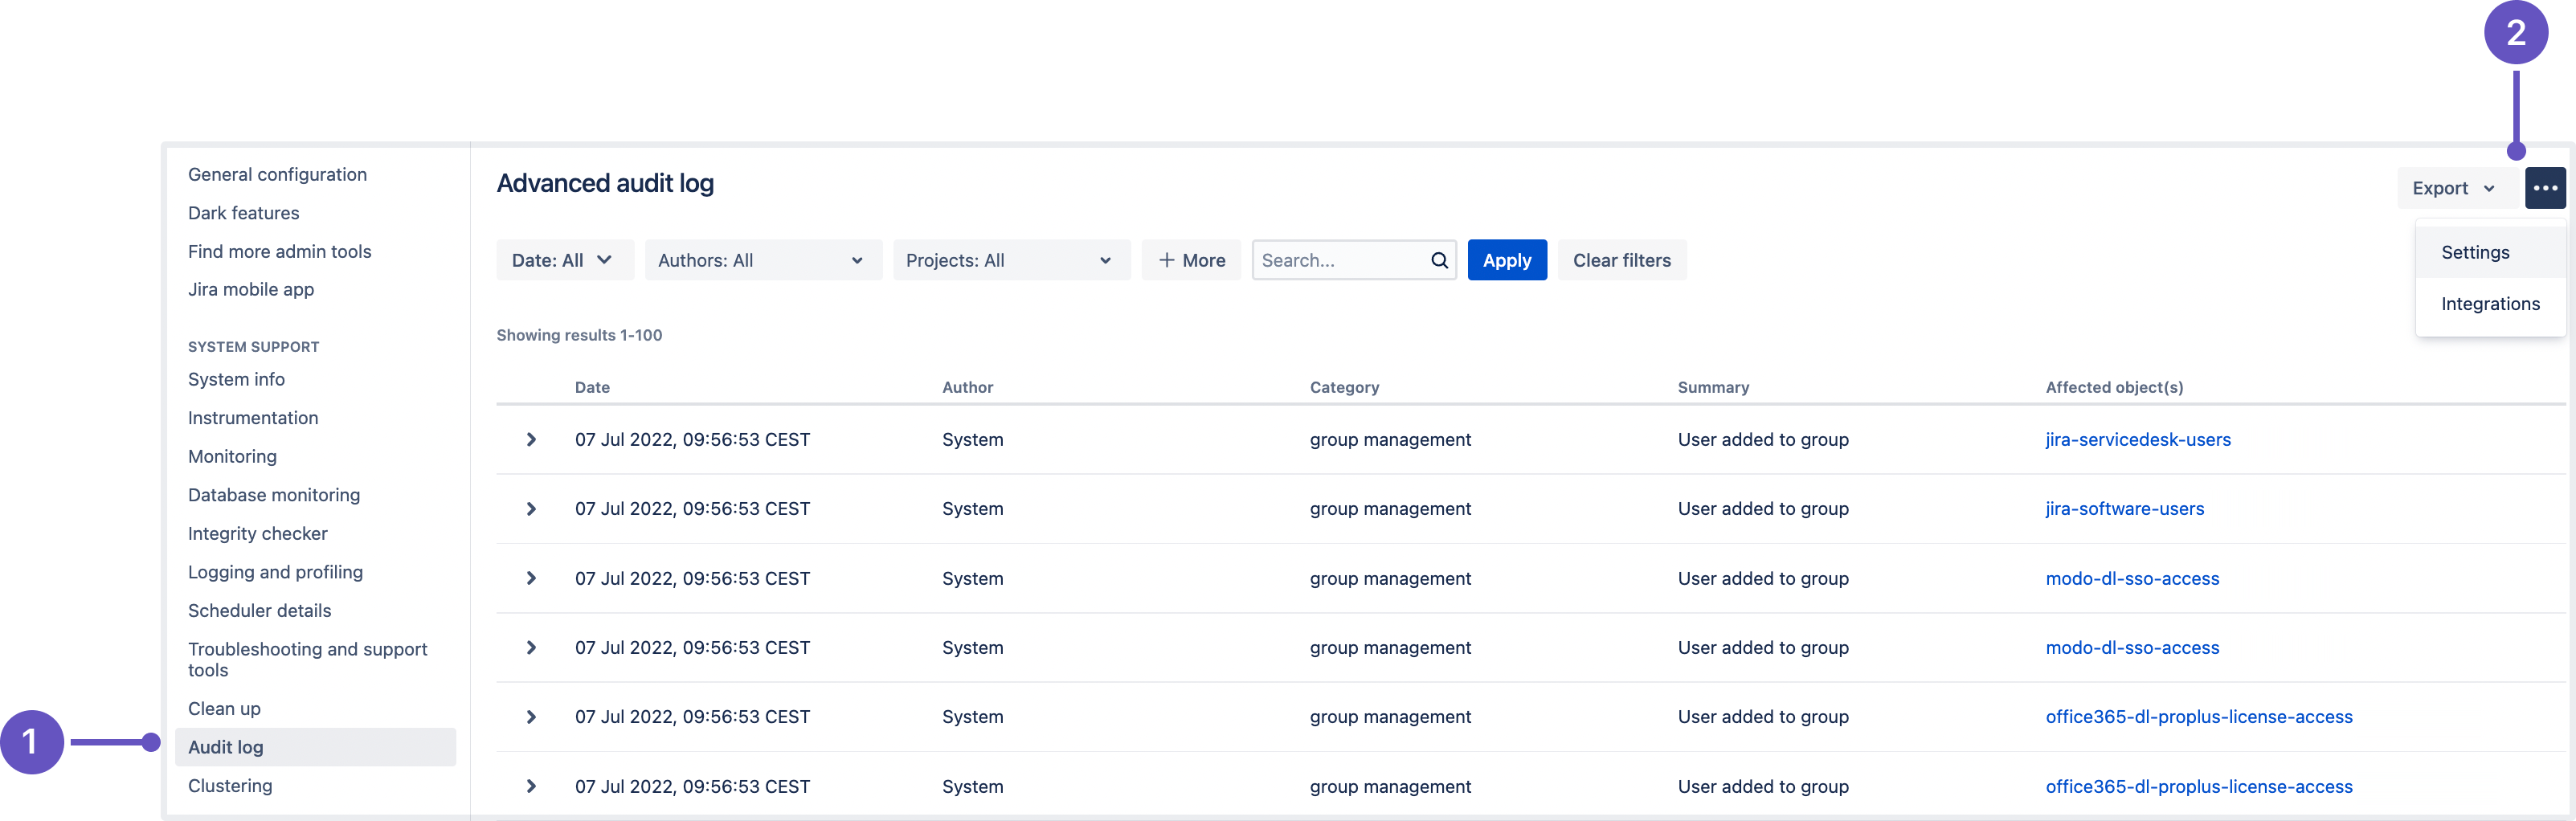
View the audit log
To view the events in the audit log:
From the app header, select Administration (
 ) > System
From the left menu, select Audit log
Select each event to expand it and see the details.

Information for each event may include:
- Source - IP address of the user who performed the action (though not recorded for system-generated events). Can also show the node IP address.
- Node ID - unique ID of the node where the action was performed.
- Method - depending on how the action was performed, will be either Browser (end user) or System (system process).
Admins, system admins, and project admins can also access audit logs for specific projects. A project-specific log can be found in Project settings and contains events relating to a this particular project.
Sprint Deleted events are recorded only in the system audit log. This is because sprints are global objects that aren't tied to a particular project or board.
Search and filter the audit log
You can search the event on keyword and filter by:
- Category
Summary
Select More to see the filters. Note that the category and the summary filters are not inclusive.- User
- Project
- Date (you need to provide date and time)
Your query can be up to 100 characters long. To speed things up, we initially search 1 million events. After this search is performed, you have an option to run a full database search. Note that the full search might take a while.
Edit log settings
In the audit log settings you can decide how long you want to retain the logged events in the database and the areas from which you want to collect the logs.
Update database retention
The database retention is limited by the retention period and the default cap of 10 million records. The cap is configurable using the plugin.audit.db.limit.rows property. If you decide to modify it, make sure your database is big enough to store all the events.
To update your database retention period, do the following:
Select Actions > Settings.
Update the retention period.
Select Save.
If you choose a long retention period, it might affect the size and performance of your database. If you decide to lower the period, all the events that exceed the newly set period will be deleted and disappear from the page. You might consider creating a backup before you lower the retention period.
If you migrated from a previous Jira version, your default retention period is 20 years. If you have a new Jira installation, it’s 3 years.
For more on selecting an optimal retention period, see How do I know what retention period is good for my audit log?
Update log file retention
In Jira Data Center, we write events to an audit log file in your local home directory. This file can be used as an additional record, and when integrating with third-party logging aggregation tools.
The maximum size of these files is 100 MB, so make sure you've provisioned enough disk space on each node, especially if you have set the logging level to Advanced or Full.
Select Actions > Settings.
Update the number of files you want to store.
Select Save.
Once a node reaches the log file retention limit, the oldest one is deleted. If you need to keep these logs, for example for compliance purposes, you may want to manually back up the files in this directory on a regular basis, or send them to a third party logging platform. See Audit log Integrations in Jira.

Select events to log
The events that are logged are organized in categories that belong to specific coverage areas. For example, login-related events are in the Login category that belongs to the Security coverage area.
![]()
For all coverage areas and events logged in each area, see Audit log events in Jira.
To adjust the coverage:
Go to … > Settings.
In the Coverage level drop-down, choose the level to log the events you need or Off to stop collecting events from a particular area.
Coverage levels reflect the number and frequency of events that are logged.
Off: Turns off logging events from this coverage area.
Base: Logs low-frequency and some of the high-frequency core events from selected coverage areas.
Advanced: Logs the core events as well as the low and medium frequency events from the coverage areas that are available only for Data Center.
Full: Logs all the events available in Base and Advanced, plus additional events for a comprehensive audit.
Changing coverage level changes the set of the events that are logged. If you can't find a specific event, it might be because coverage level was changed and these events were not logged for a period of time. Check all audit log configuration events to see if that might have been the case.
Exclude events from the audit log
You can configure which activities you want to track in Jira by adding or excluding those activities from audit log. To exclude audit events from being logged:
- In the upper-right corner of the screen, select Administration
 , then System.
 - Under System support, select Audit log.
- Open the Audit log settings page:
 1. Audit log: Here, you can view all events recorded in the log.
2. Settings: A tab where all the audit log settings are configured. - View and add the events by scrolling down to the bottom of the page:
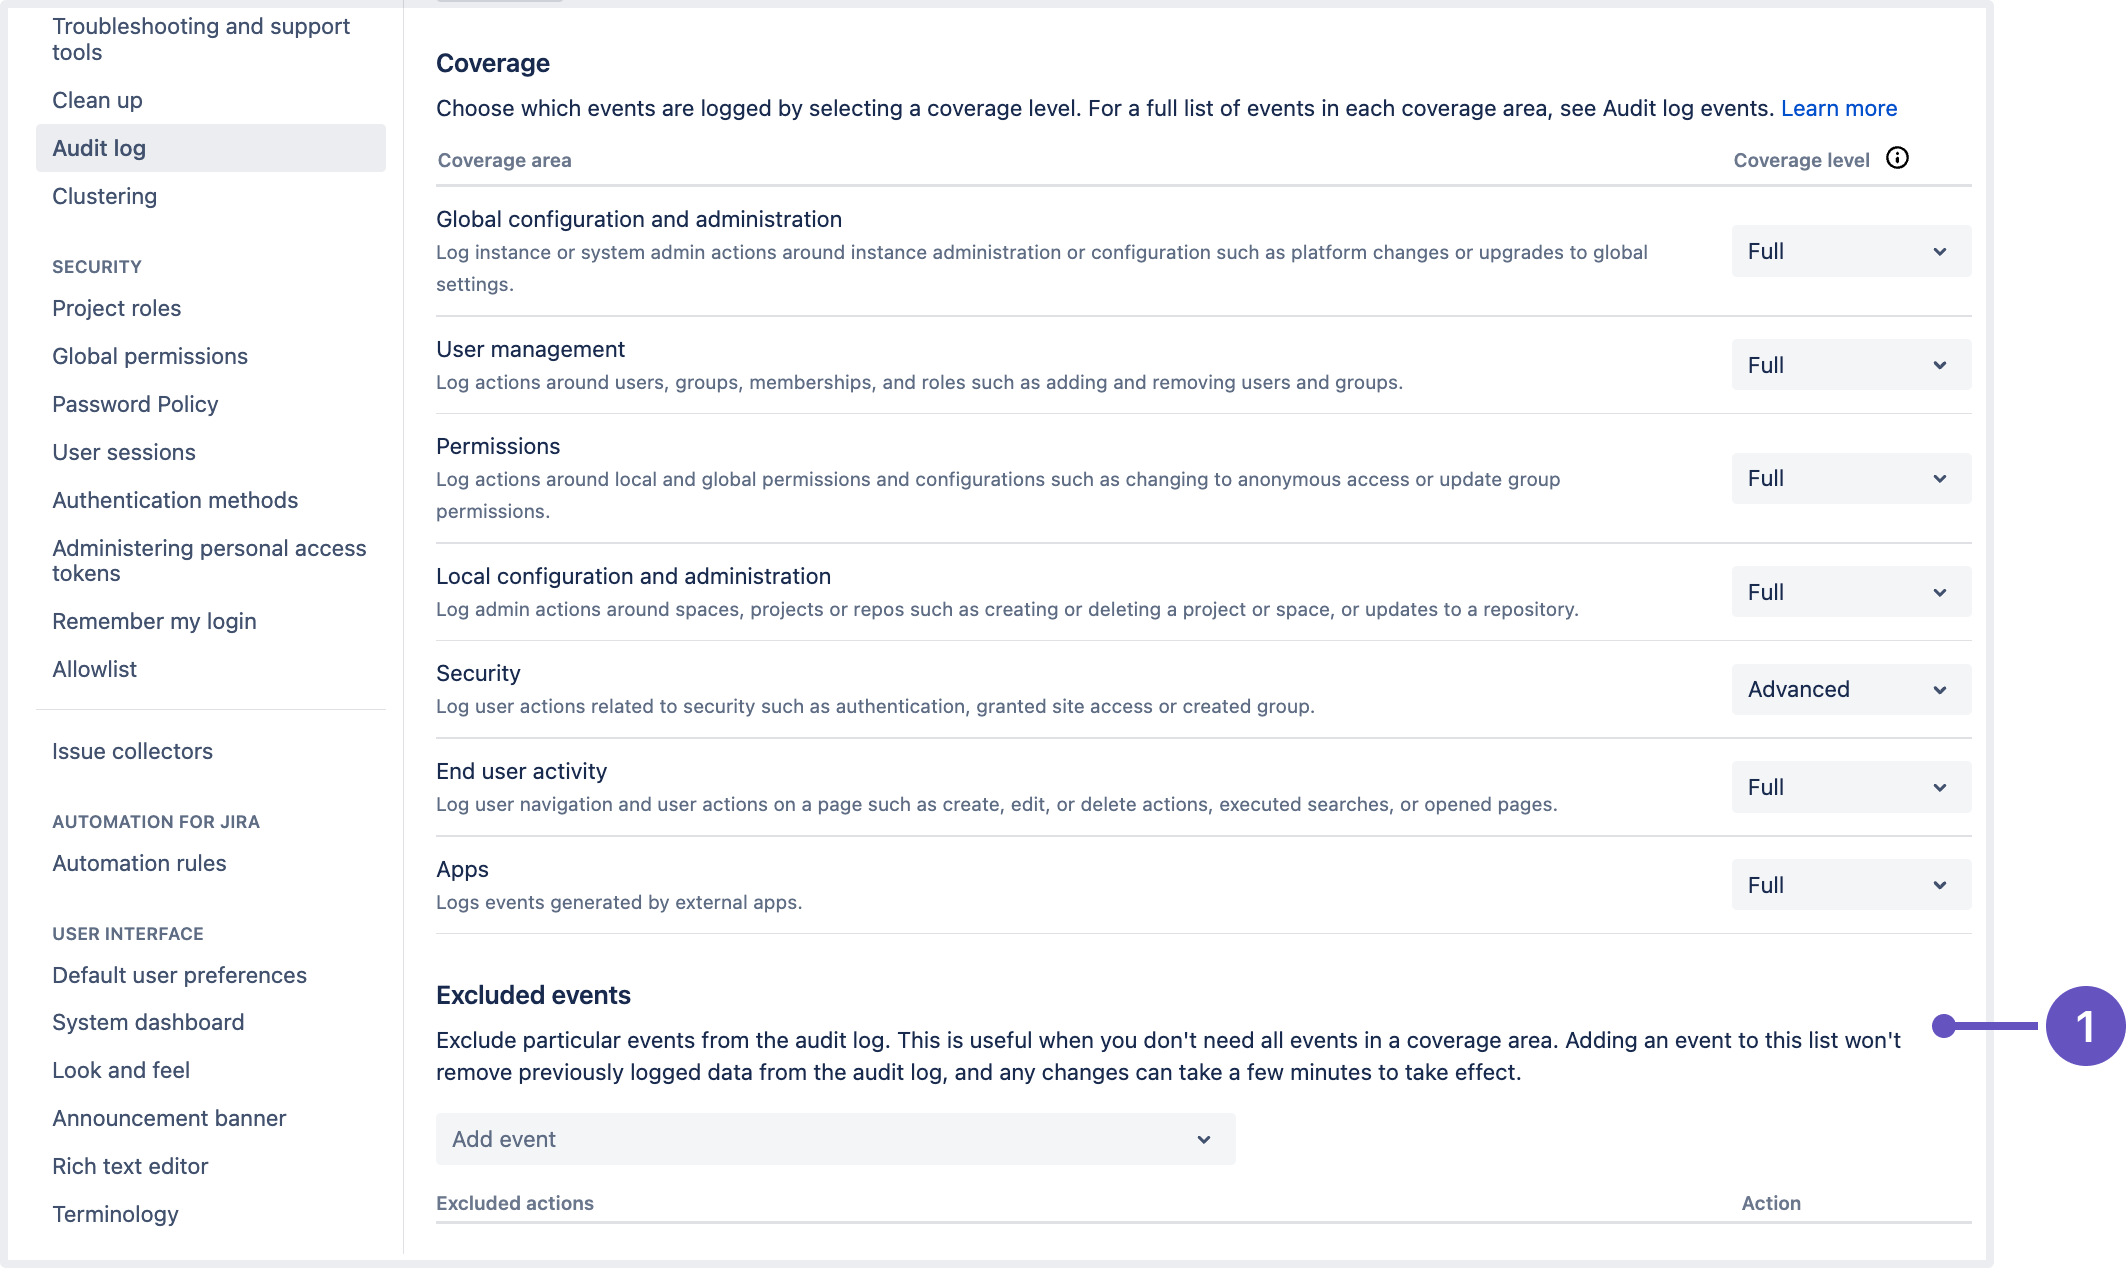
1. Excluded events: this is where admins can block events from being recorded.
Export the audit log
You can export up to 100,000 events as a CSV file. If you have more than 100,000 events, only the 100,000 newest events are included in the export. If you run Jira Data Center, you can also export filtered results up t o 100,000 events.
Navigate to the Audit log/ Advanced audit log and select Export.
Select to export the latest 100,000 or filtered results.
Confirm by clicking Export again.
Access the audit log file
Each node has its own log and can be found in the <Jira local home directory>/log/audit directory. The log is stored as a file.
This directory has a file limit of 100 files, and each file has a size limit of 100 MB. Jira checks the directory every 24hrs. If these limits have been reached, it will delete the oldest file.
Integrate with external software
You can use the log file to integrate with ELK, Splunk, Sumologic, and Amazon CloudWatch. For more information on integrations, see Audit log integrations in Jira.
Audit log and migration
Migrate database
If you have more that 10 million events stored in your database, and you move to a new database, only the latest 10 million will be migrated and the remaining data will be removed. To have access to your older events you can either create a backup before you migrate and access the data in the backup.
Migrate from a previous Jira version
Migrating audit log records might take up to several hours depending on the size of the audit log and the type of your database. If you migrate using , you can still use your Jira during migration.
You can use the jira.advanced.audit.log.migration.limit flag in the Jira properties file to limit the number of events you want to migrate or to turn off the migration altogether. If you decide to turn off migration, your new audit log will only show the events that happen after upgrade.
To make sure the limit works, provide the property directly as a command line argument or via the setenv.sh }}\ {{setenv.bat file. For example:
JVM_SUPPORT_RECOMMENDED_ARGS="-Djira.advanced.audit.log.migration.limit=10"We migrate the existing events to the database not to files. We migrate only 10 million entries from the old audit table to the new one.
Auditing and the API
The audit log can also be accessed via the API.
Auditing properties
These properties control the auditing feature, determining the number of audit entries logged, or stored in the database, and the size of those entries. Changing these settings will only affect new audit entries.
Increasing the amount of auditing done may have an adverse effect on performance.
| Default value | Description |
|---|---|
plugin.audit.search.max.concurrent.nontext.requests | |
10 | Maximum number of concurrent non-freetext search requests allowed, defaults to 10 per node |
plugin.audit.search.max.concurrent.text.requests | |
5 | Maximum number of concurrent freetext search requests allowed, defaults to 5 per node |
plugin.audit.search.query.timeout | |
30 | Timeout in seconds for a queued search request, defaults to 30 seconds |
plugin.audit.db.limit.rows | |
10000000 | Maximum number of audit event rows stored in DB, events exceeding the limit get deleted in time order, defaults to 10M checked on hourly basis |
plugin.audit.db.limit.buffer.rows | |
1000 | Buffer to accommodate new audit events, defaults to 1000 rows |
plugin.audit.db.delete.batch.limit | |
10000 | maximum number of events to be deleted per database transaction used when enforcing retention limits, defaults to 10,000 rows |
plugin.audit.schedule.db.limiter.interval.mins | |
60 | Database size check, running every 60 minutes |
plugin.audit.broker.exception.loggedCount | |
3 | Maximum number of audit events written to system log file in case of error, defaults to 3 |
plugin.audit.retention.interval.hours | |
24 | Database retention check, which deletes events exceeding retention period, running every 24 hours |
plugin.audit.file.max.file.size | |
100 | Size limit in megabytes for individual audit file, file rotates when limit is reached, defaults to 100MB |
plugin.audit.file.max.file.count | |
100 | Maximum number of audit files, the earliest file will be deleted when limit is reached, defaults to 100 |
plugin.audit.consumer.buffer.size | |
10000 | Maximum number of audit events kept in buffer waiting to be consumed, defaults to 10,000 |
plugin.audit.broker.default.batch.size | |
3000 | Maximum number of audit events dispatched to consumer, defaults to 3,000 per batch |
plugin.audit.coverage.cache.read.expiration.seconds | |
30 | How long the coverage cache is valid, defaults to 30 seconds |