Displaying the dependencies map
The dependencies map is an early access feature and must be enabled by an administrator to be used. Visit the Early access features page to learn more.
In this article, we’ll discuss how to view your project’s dependencies using the dependencies map. This view displays issues as tiles with arrows to illustrate which issues are dependent on others.
To open this view, click on the Dependencies tab underneath your plan name (if enabled).
Switching to this view will not alter your plan.
Filtering your dependencies
The dependencies map gives you three different ways to sort and view your dependencies:
Roll up to
Group by
Filter by issue
Roll up to
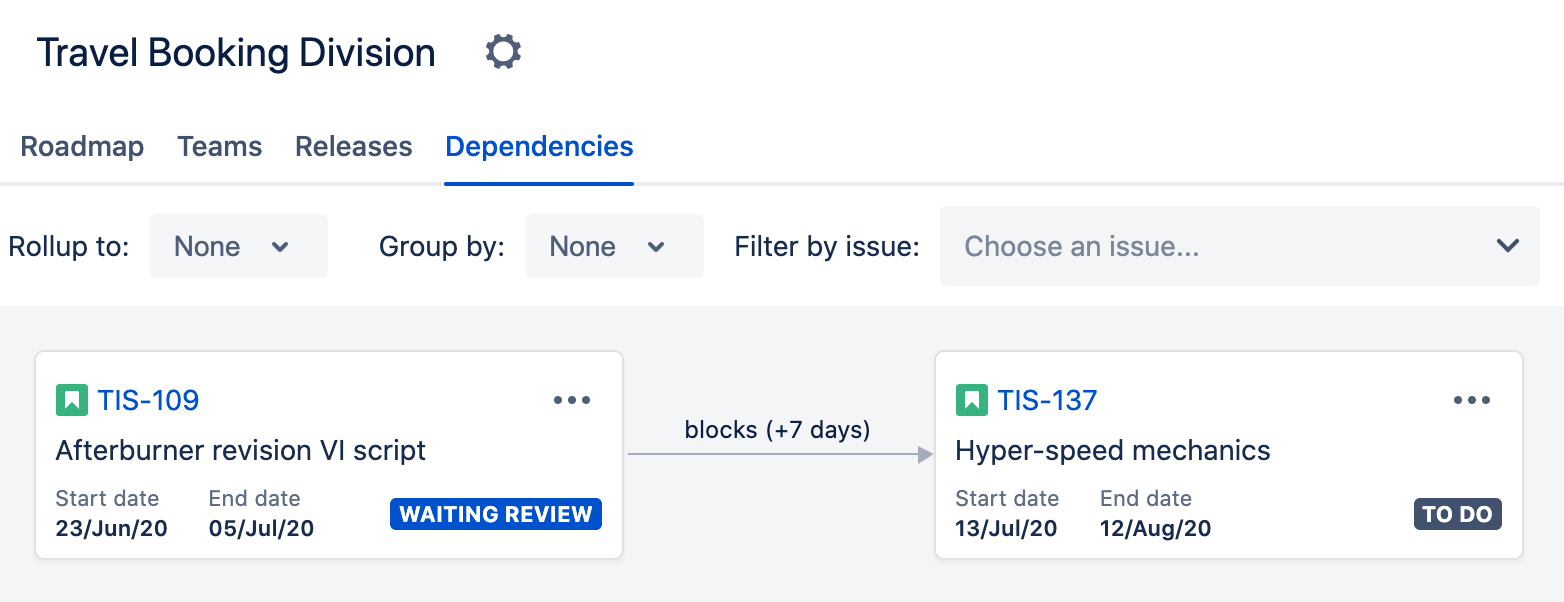
This feature allows you to choose at which hierarchy level you would like to view your dependencies. In the picture below, we can see that TIS-137 is dependent on TIS-109, both of which are at the story level.
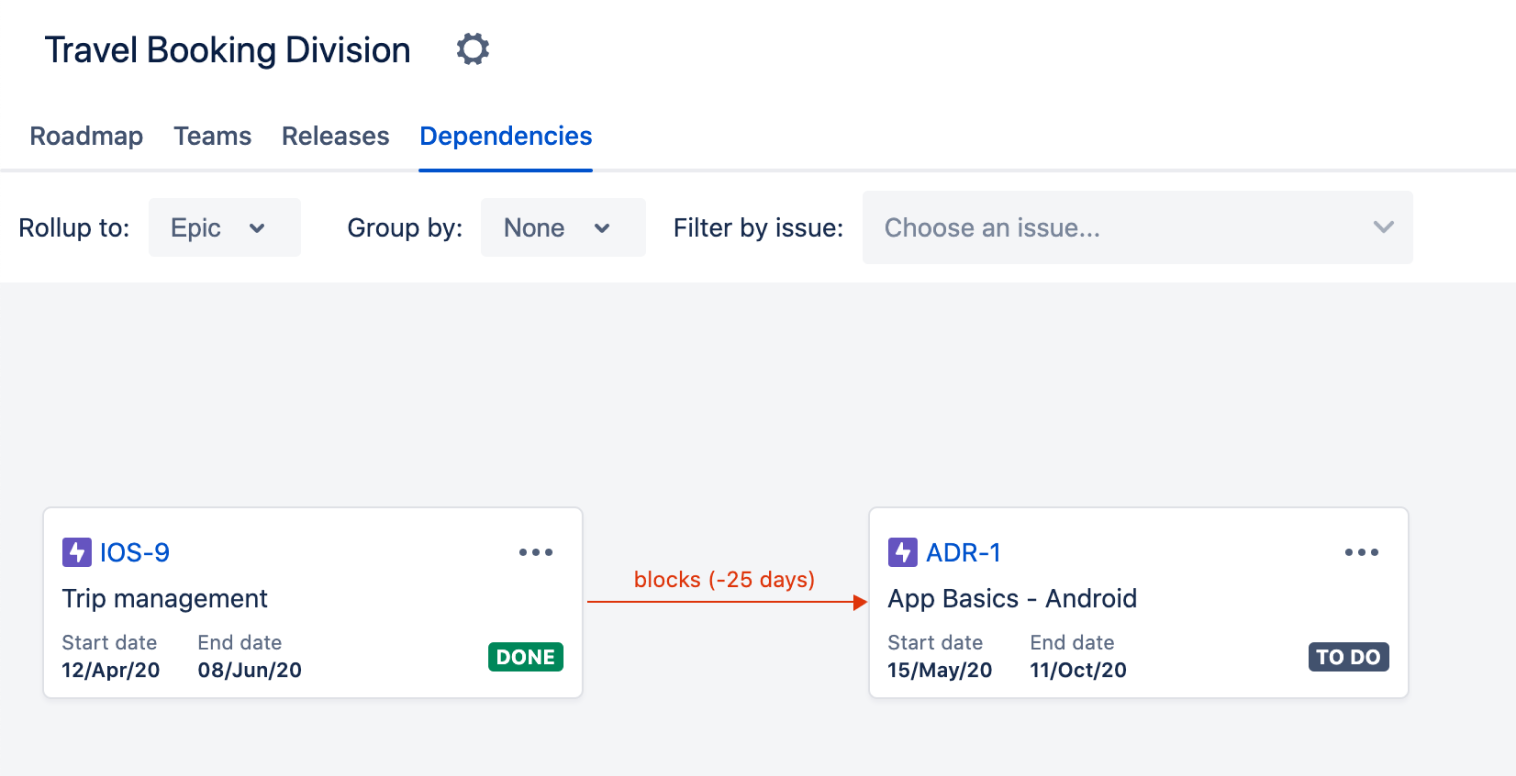
And here’s that same dependent relationship rolled up to the epic-level view:
Group by
You can also see dependencies based on which team they’re assigned to by clicking the Group by menu and choosing Team. This will add light gray boxes to your map that show dependencies based on the team to which the issues are assigned.
Filter by issue
Lastly, you can Filter by issue to highlight a single issue and see a visual layout of its dependencies. In the map below, there are two separate dependency chains:
In the next picture, we’ve added a filter to highlight a specific chain of dependencies and remove unrelated issues:
Reading your map
The arrows that show the flow of your dependencies can mean different things based on their color and style.
Solid gray arrow
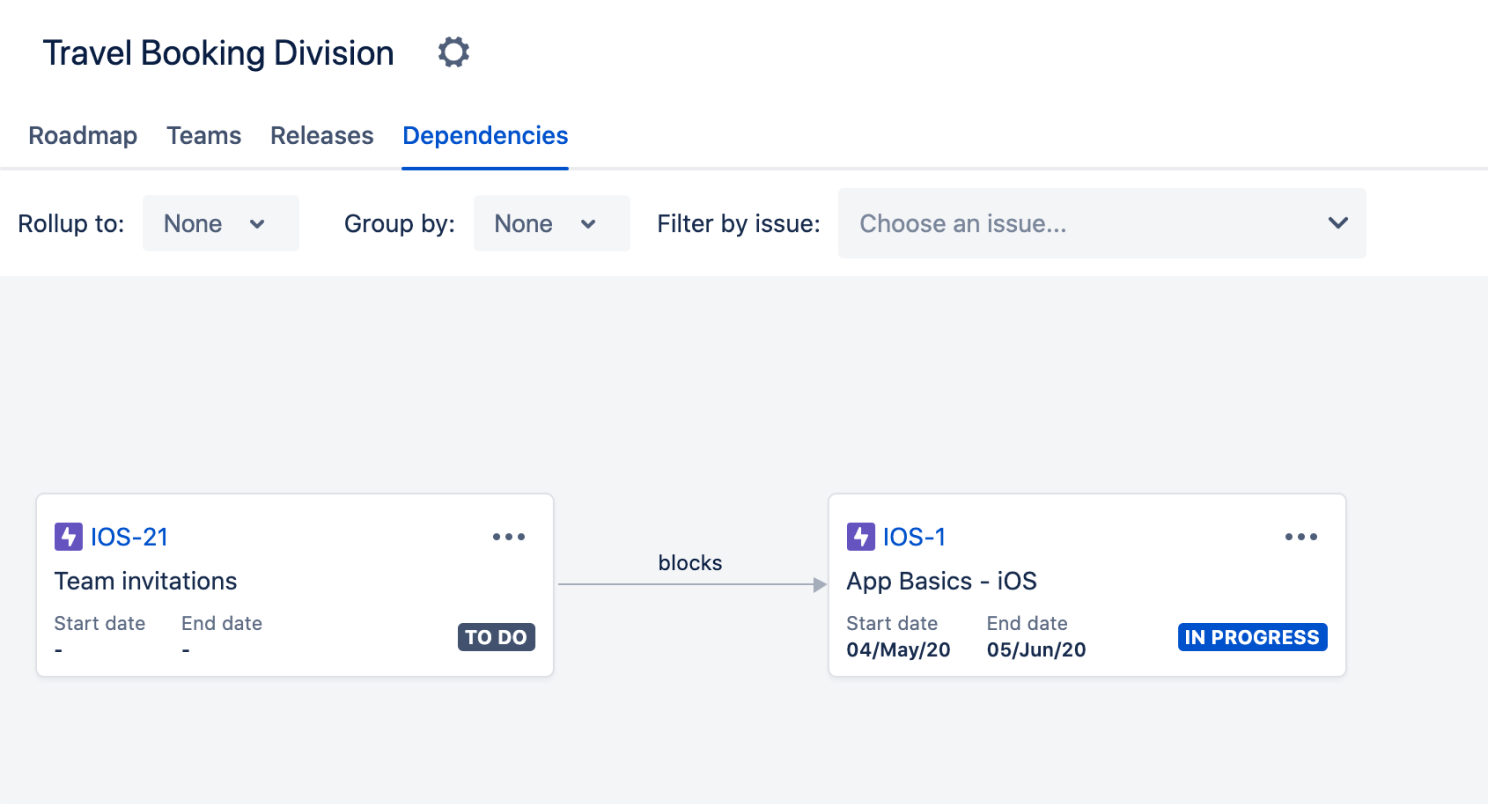
If your arrow is solid gray, then you have a normal and valid dependency with no warnings or errors.
Red arrow
The arrow will turn red if there’s an error or warning attached to your dependency. To learn about some of the common warning types and how to solve them, check out our page on Viewing warnings.
Dotted gray line
You might also find that some of your dependencies have a dotted gray line connecting them. This is to indicate that the dependency being referenced is not of the same hierarchy level as your current view.
In the example below, we have one story-level task on the right (TIS-109 which belongs to the epic TIS-111) blocking another story-level task (TIS-137 which belongs to the epic TIS-114). Between two issues is a solid gray arrow, indicating a dependent relationship.
If we roll up to the epic level however, the arrow becomes a gray dotted line. This is because while they have stories that are dependent, the epics are not. To convey this indirect relationship between the two epics, we use a dotted gray arrow:
However, it’s still possible to see what the dependent issues are in this view by clicking on the x links text above the dotted gray arrow. This will bring up a box showing which issues are related, as seen below:


