Setting up service project reports
Reports allow teams to look at trends in their project such as the amount and types of requests received, and how they're resolved. We recommend that all teams use reports, especially those who use SLAs. Read more about reporting on SLAs.
To view or create reports, go to Reports from your service desk project's sidebar. You must be a project administrator to create or edit reports.
If the JQL filters in your reports use priorities, make sure these filters include all the priorities defined in the associated priority scheme. See Associating priorities with projects for more details.
Compare requests created vs requests resolved
The most common way to measure your service team's health is by comparing how many requests come in with how many your team can resolve.
Resolution trends like this can answer questions like:
- Was this week's volume of requests a one-time occurrence or the start of a trend?
- Do we support a service that causes more issues than it's worth?
- Is our service project scaling with our business or do we need to add staff?
We include this report by default because it's the quickest way to check the health of your service project. You can find the other default reports in the Reports sidebar.
To compare requests created vs resolved:
- From your service project, go to Reports.
- Select the Created vs Resolved report in the sidebar.
- In the dropdown field below the graph, choose the date range you’re interested in.
- Click on a number count in the table to drill down into individual requests.
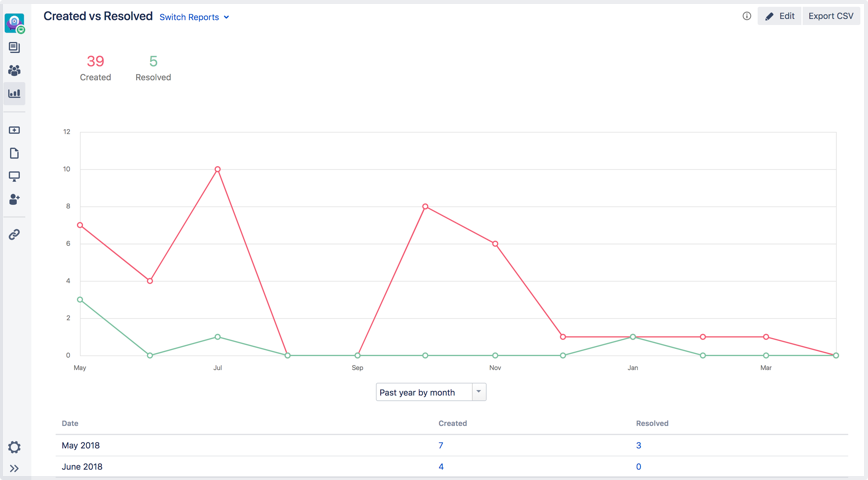
You can also create a CSV report of the dataset by choosing Export CSV in the top right-hand corner.
Default Jira Service Management reports
Here are the reports we include by default:
Report name | Details |
|---|---|
| Workload | The number of requests assigned to your agents |
| SLA goals | How your team is tracking towards each of the SLA goals you have set |
| Satisfaction | The average customer satisfaction rating for your team |
| Article usage | The number of times your customers viewed knowledge base articles in the portal and found them helpful
|
| Article effectiveness | The number of requests resolved with and without knowledge base articles
|
| Created vs resolved | Compares the number of requests created and resolved over time |
| Time to resolution | Compares the length of time taken to resolve requests of type or priority |
| SLA met v breached | Compares the number of requests that have met or breached an SLA goal |
| Resolution by component | Compares the resolution times for each component (for basic service desks only) |
| Incidents reports by priority | Compares the priority of incidents your customers have reported (for IT service desks only) |
Besides the above, you can dig deeper. Why does your performance look like this? Create custom reports for your service desk and explore this question.
Create custom reports
Custom reports, where you define the series, help you to find out more about why your performance is the way it is.
Series are a set of data points used to make reports. For example, a series could be the number of requests received on day 1, 2, 3 and so on for the past week. This would compare the difference in the number of requests received on each day of the week. While they can point out trends on their own, they're more powerful when plotted together.
To create a custom report:
- From your service project, go to Reports.
- Select New report.
- Choose a report name that you and your team will understand. For example, High priority issues would be a report that shows data on prioritized issues.
- Click Add a series.
- Fill in the following details: Series, Label, Color, and, optionally a filter.
- Click Add.
- Add more series to compare values.
- Click Create.

Check out the recommended reports below to explore how reports benefit your organization. See examples of what series and their associated JQL filters may be useful to you. Read more about Advanced searching through JQL.
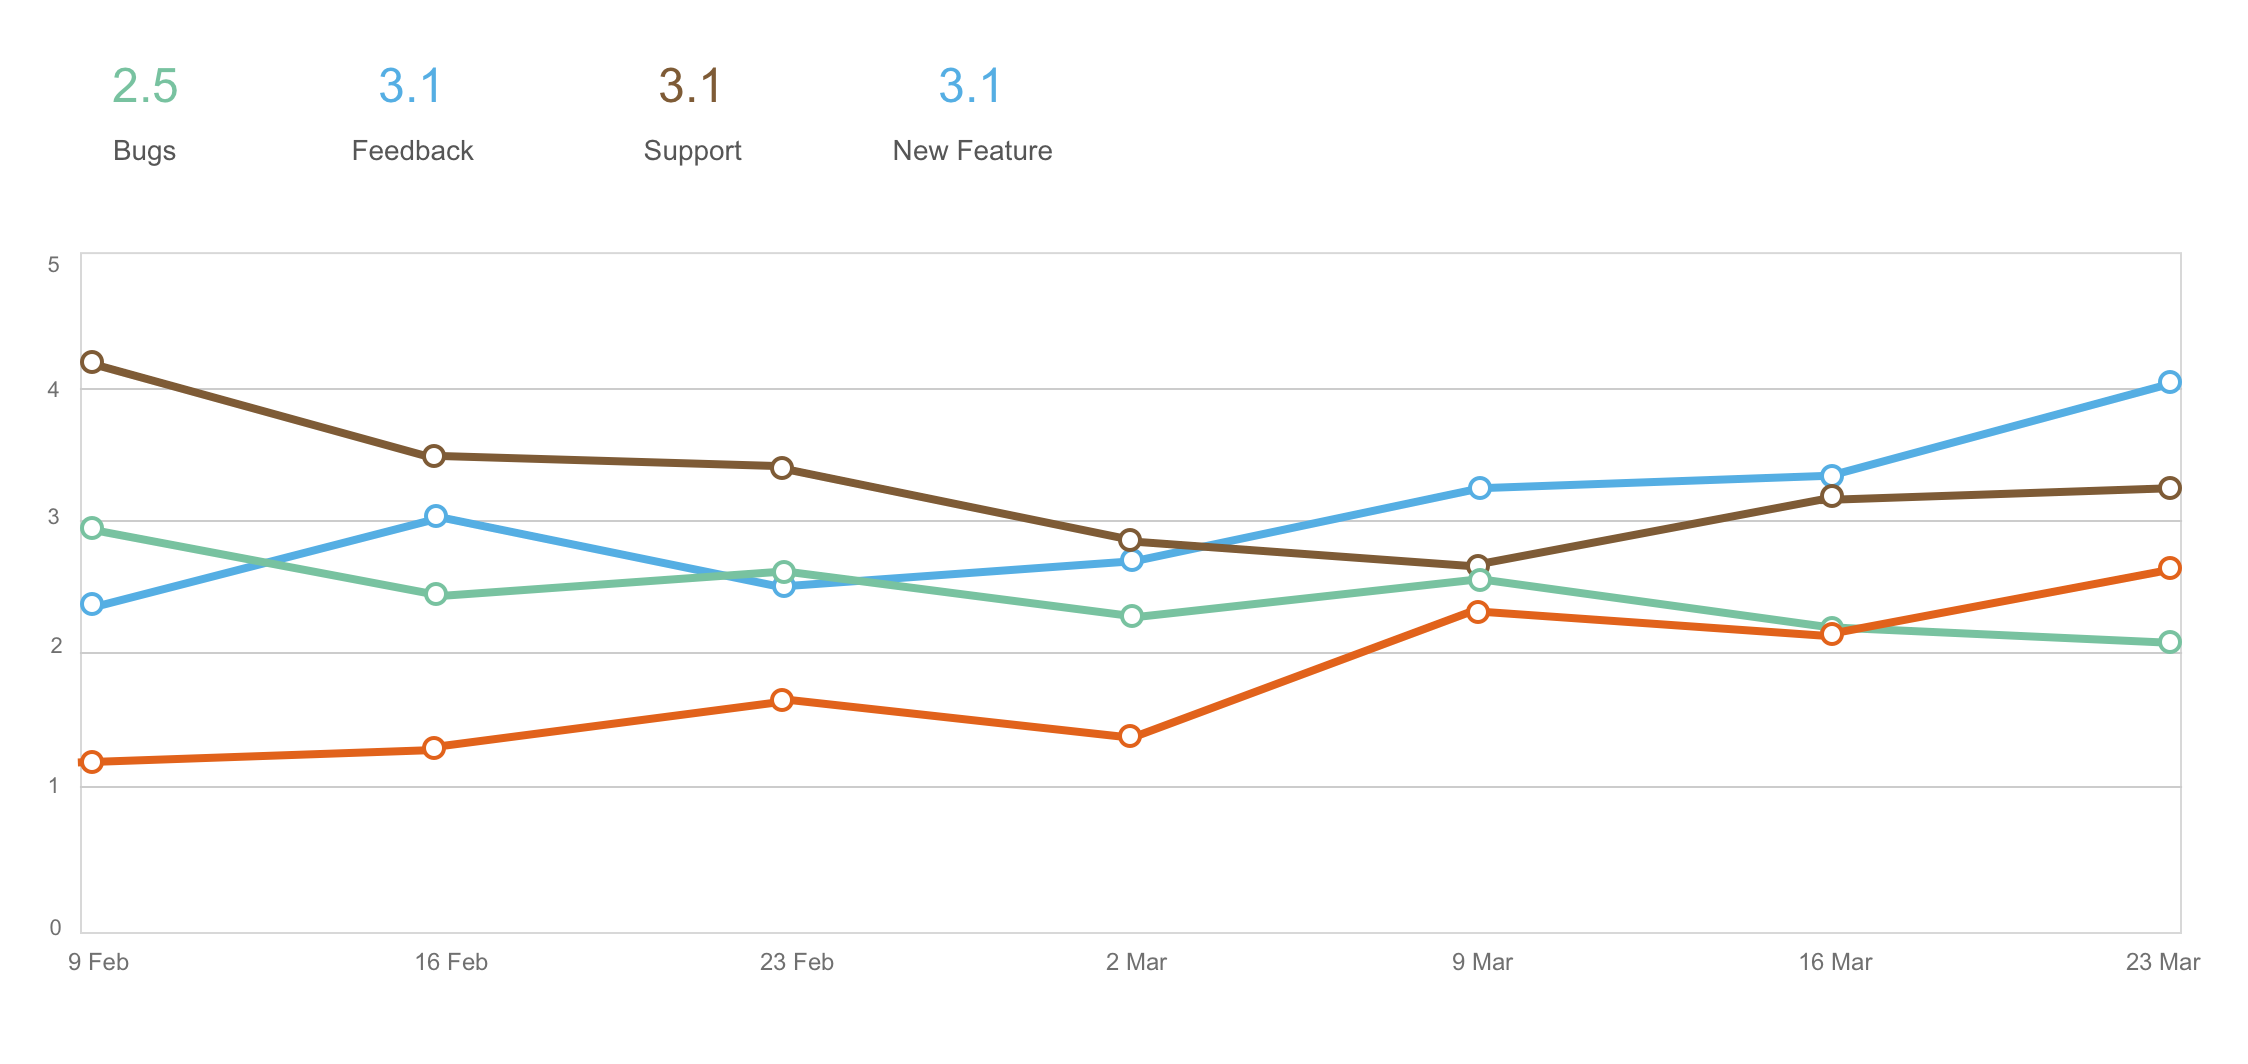
Customer satisfaction report
One of the best measures of performance is your customers' happiness. Jira Service Management comes with reports on customer satisfaction, but a custom report can help you find more trends. First, be sure to collect customer satisfaction information on your requests. Learn how to enable customer satisfaction feedback.
Use the average rating customer satisfaction series to see how your team performs. For example, you can use issue types to investigate sections of your business.
To create a report to see if your customers are satisfied:
- From your service project, go to Reports.
- Click New report.
- Enter "Customer satisfaction" as the Name.
- Add the following series, then click Create:
- Series = Average rating
- Label = Bugs
- Filter by (advanced) = issuetype = "Bug"
- Series = Average rating
- Label = Feedback
- Filter by (advanced) = issuetype = "Feedback"
- Series = Average rating
- Label = Support
- Filter by (advanced) = issuetype = "Support"
- Series = Average rating
- Label = New feature
- Filter by (advanced) = issuetype = "New feature"
You might find some interesting results. For example, your response to feature requests may please your customers, but, they aren't happy when they raise requests about billing. If you select a data point in the report you can look for feature words like "payment" or "credit card".
Details like these can expose your customers' pain points. Maybe your organization needs an easier to use billing form. Or perhaps you can be clearer about how much your products or services cost, or which credit cards you accept.
Requests created per channel report
Monitoring how your customers submit requests can give you useful insights. Are you getting more requests from email than from your customer portal? You can create a report to see how many requests customers create in each channel.
To create a report to track requests sent by portal and email:
- From your service project, go to Reports.
- Click New report.
- Enter "Requests created per channel" as the Name.
Add the following series and click Create:
- Series = Created
- Label = Email
Filter by (advanced) = request-channel-type = email
- Series = Created
- Label = Portal
Filter by (advanced) = request-channel-type = portal
- Series = Created
- Label = Agent on behalf of customer
Filter by (advanced) = request-channel-type = Jira
The last series catches issues agents raise outside the portal.
How your customers request help might surprise you. You might find that your agents raise more and more requests on your customers' behalf. If so, you can find ways to direct customers to your portal or email channels. That way your agents have more time to resolve issues, rather than raise them.

Average resolution time by issue type report
Jira Service Management tracks requests by time. The time it takes your team to resolve a type of issue can show trends in your teams' efficiency.
To create a report to see your average resolution by issue type:
- From your service project, go to Reports.
- Click New report.
- Enter "Resolution by issue type" as the Name.
- Add the following series and click Create:
- Series = Time to resolution (Avg.)
- Label = General requests
- Filter by (advanced) = "Customer Request Type" = "General requests"
- Series = Time to resolution (Avg.)
- Label = IT help
- Filter by (advanced) = "Customer Request Type" = "IT help"
- Series = Time to resolution (Avg.)
- Label = Requests with approvals
- Filter by (advanced) = "Customer Request Type" = "Request with approval"
You may find that IT help requests take more of your teams' time than general requests. Take into account how many IT help requests come through your service project. With this info, you can better divide your agents, and their time, to make your customers happier.

Regional trends report
If you service more than one location, you can cut out noise by viewing your regional performance. Start by adding labels to requests, identifying and helping to sort them into regions.
For example, if your business operated in New York and Rio de Janeiro, your service project agents can add a location label to requests from each region.
To create a report to see how many requests come from each location:
- From your service desk project, go to Reports.
- Click New report.
- Enter "Requests by region" as the Name.
- Add the following series and click Create:
- Series = Created
- Label = New York
Filter by (advanced) = labels = ny
- Series = Created
- Label = Rio
Filter by (advanced) = labels = rio
If you see an increasing trend in one location, you may decide to shuffle around resources. Maybe you've opened a new location without a dedicated service project team member, and the new location finds it difficult to ramp up operations. Perhaps you need to send someone to provide training? Or, maybe there's a language barrier with your knowledge base. You may consider providing support articles in more than one language.
You might see the opposite, a decline in requests coming from one location. Are people abandoning your service project? Do you need to make it clear that the service project operates for all locations?