Preparing for Jira 9.1
This documentation is intended for Jira developers who want to ensure that their existing apps are compatible with Jira 9.1
Upgrading from 8.x to 9.x triggers full Jira reindex that causes some downtime during the process. If you’re on 8.x now, make sure you’ve estimated the downtime and set the best time for the upgrade.
Learn more about how to handle full reindex and estimate downtime
Quick info
Latest version
Here you can find information about the latest EAPs.
| Application/Date | number | Version (Maven) | Downloads |
|---|---|---|---|
Jira Core/Software
| 9.1.0-EAP02 | 9.1.0-m002 | Source files (Core) Source files (Software) |
Jira Service Management
| 5.1.0-EAP02 | 9.1.0-m002 |
Summary of changes
In this section we'll provide an overview of the changes we intend to make, so you can start thinking how it might impact your apps. Once they're ready, we'll indicate when a change has been implemented, and in which milestone.
Sprint caching improvements
Status: IN PROGRESS
We're introducing two new caches to improve Jira’s performance during the concurrent usage of Agile sprints. This change will also help to mitigate the sprints scale and growth factor in performance matters.
The following caches will be added:
- a fine-grained cache that holds a single entry for each sprint and lets you instantly retrieve sprints by IDs.
- a cache that holds Sprints per board, which are accessible by rapid view ID.
The new configuration will ensure a faster cache population, allowing Jira to perform such actions as opening an Agile board much quicker. This will enable teams to work simultaneously without being blocked by slow board loading time or facing timeout requests.
You can find more information about the problem we’re fixing in this ticket:
JSWSERVER-20618
-
Performance of Jira can degrade significantly due to slow sprint cache population
Closed
Excluded events for advanced audit log
Status: IMPLEMENTED
We've added new functionality that allows excluding some audit events from being recorded in the log. The new feature is available for admins on the Audit log settings page under the System support section (in the left-side panel).
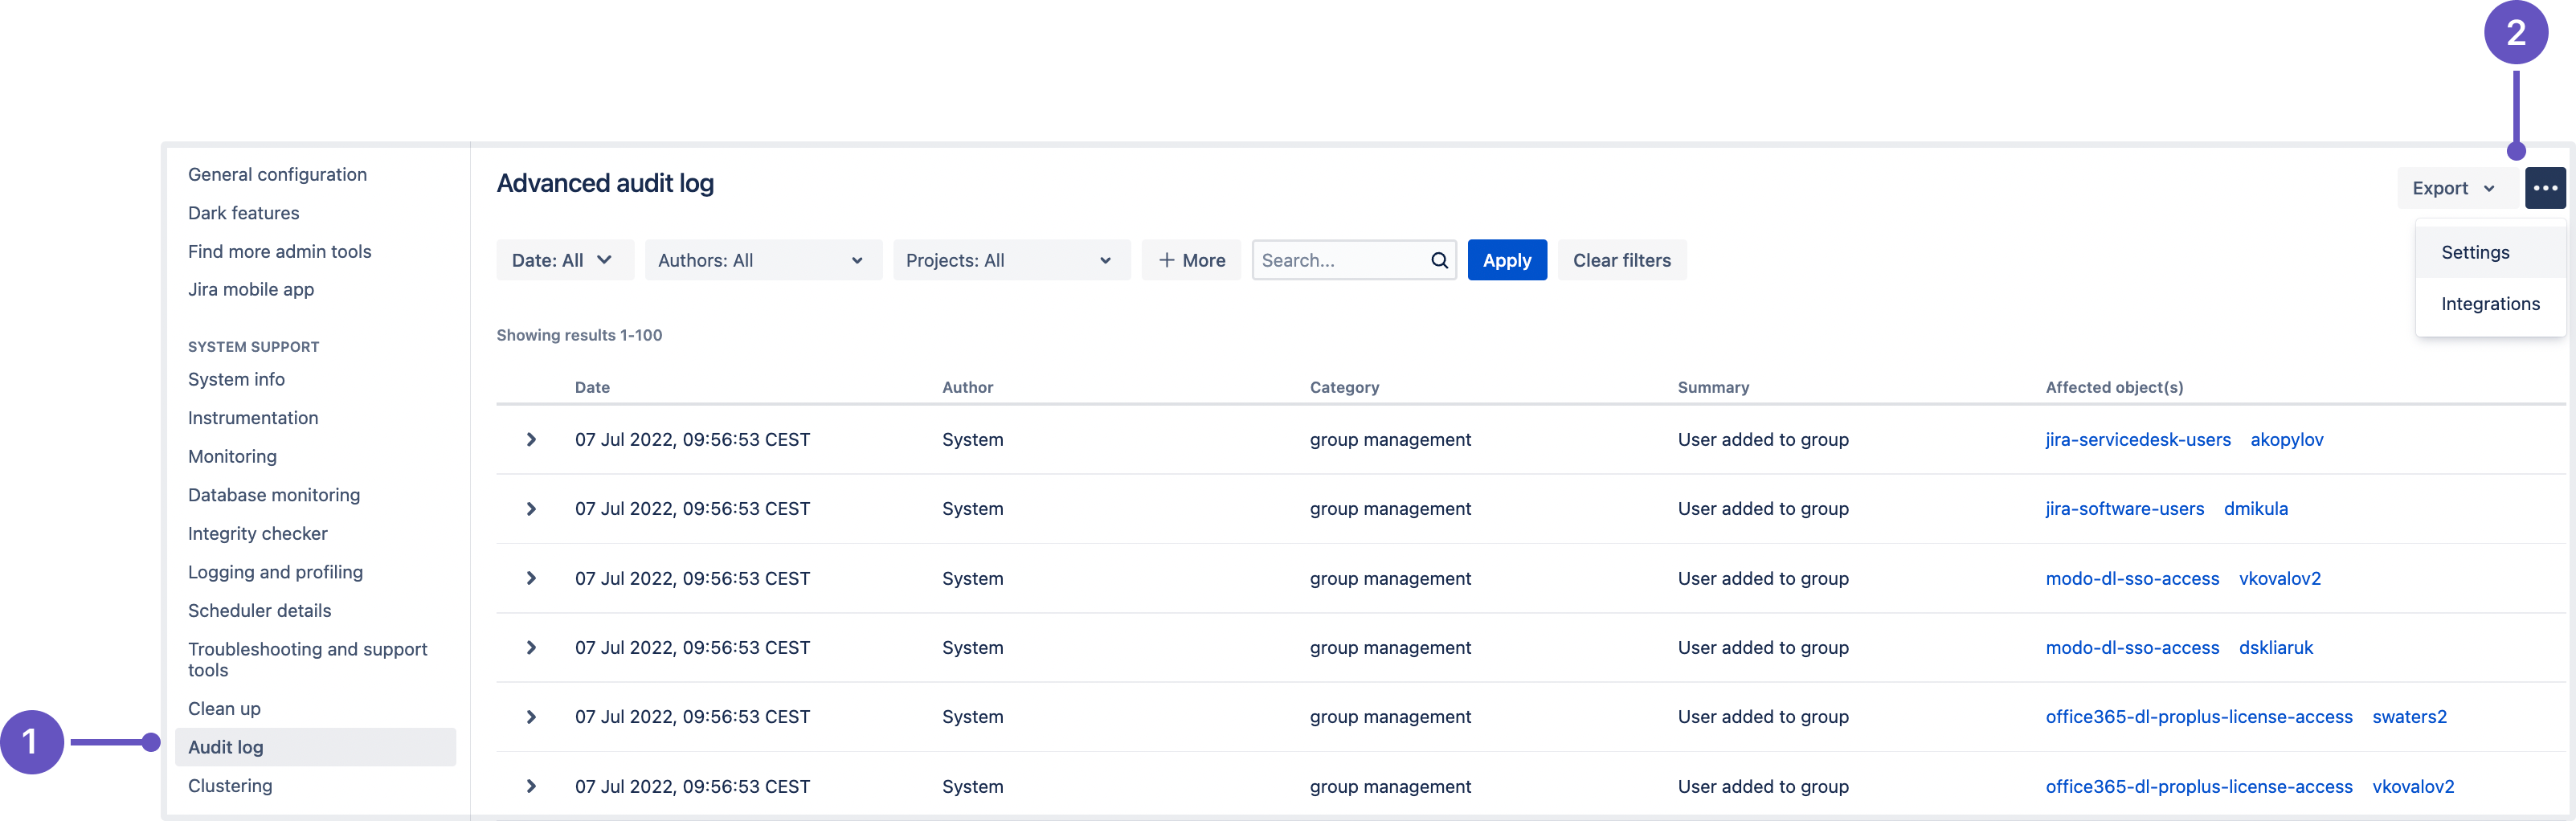
- Audit log: Here you can view all events recorded in the log.
- Settings: A tab where all the audit log settings are configured.
You can view and add excluded events by scrolling down to the bottom of the page:

- Excluded events: this is where admins can block events from being recorded.
To access the feature, a user must have Jira System admin rights.
Apps performance monitoring via JMX
Status: IMPLEMENTED
We've instrumented metrics available via JMX that allow measuring and monitoring the performance of your apps that can be paired with the APM tool of your choice such as Grafana, NewRelic, or App Dynamics.
With this update in place, you can quickly check if an app is contributing to poor system performance as well as identify potential problems. Some of the things you can now monitor include how long it's taking to render web resources, perform operations, do garbage collection, and more.
What do you need to know?
- We’ve provided example Grafana dashboards that are ready to use or to serve as inspiration for your existing dashboards. The source code for Grafana dashboards is available on Github.
- You need a Prometheus-compatible server to use real data in Grafana. The setup instructions are available in the Getting started guide.
- There are no changes to the installation or upgrade process as part of this feature.
- There are no database schema changes added as part of this change.
- This feature introduces a new
UpgradeTask_Build901000, which enables JMX monitoring by default. This is required for app monitoring to function.
How do you turn off the feature?
This feature is enabled by default. You can disable it in several ways.
- Disable app monitoring cluster-wide from the Administration menu:
- Open the monitoring page by going to Administration > System > Monitoring
or navigate to/secure/admin/JmxMonitoringAction.jspa. Turn off the App Monitoring toggle.

If you want to turn the feature on, make sure that the JMX Monitoring toggle is enabled as well. Otherwise, the app monitoring won’t work.
- Open the monitoring page by going to Administration > System > Monitoring
- Disable app monitoring cluster-wide via API. See Changes to the API section for details.
- Disable app monitoring per-node via the
com.atlassian.profiling.ita.metrics.denysystem property.
Changes to the API
- Added
POST@/rest/api/2/monitoring/app that accepts content type application/json {isEnabled:"true/false"}to enable or disable the feature cluster-wide. - Introduced a new
com.atlassian.diagnostics.internal.platform.plugin.ClassNameToPluginKeyStoreclass that debug logging can be enabled for. The class has two debug lines that could explain why it’s not possible to attribute a plugin for using the database on thedb.core.executionTimemetric:Came across a null bundle while rebuilding the map of classnames to plugin keys after the plugin event: {}The plugin event {} triggered rebuilding the map of classnames to plugin keys, but wasn't able to get the wiring for bundle: {}
Email channels audit log
Status: IMPLEMENTED
App: JIRA SERVICE MANAGEMENT
Stay on top of your email channels with the new audit log. You can now easily check if the connection with your email channels is active and make sure all incoming emails are being processed correctly. The audit log consist of two different tabs:
- A processing log that shows every message received from the connected email account. It allows you to search and filter to find specific emails.
- A connectivity log. Jira Service Management attempts to connect to and pull new messages from your email channel every 60 seconds. The connectivity log shows the history of the results of each attempt.
Insight accessibility and uplift
Status: IMPLEMENTED
App: JIRA SERVICE MANAGEMENT
Continuing with the Insight accessibility and improvements, in this release we’ve fixed:
- color contrast issues
- object schema view issues
- issues with the graph component across various views.
Better PSMQ information logging
Status: IMPLEMENTED
App: JIRA SERVICE MANAGEMENT
We’ve improved the information logging process that helps the support team troubleshoot PSMQ-related issues. Some of the improvements include:
- Added missing information in logs about the message processing time and the total wait time for a message in the queue.
- PSMQ queues message counts are outputted every minute in logs if Debug trace is enabled.
- The current Queue configuration is available via the configuration page.
What do I need to know?
- More information is shown at the Trace level than the Debug level.
- The PSMQ queues message counts information displayed in the logs is fetched from the MESSAGE_COUNT column in the queue table which can be different than the actual messages in the MESSAGES table. We did this to avoid overloading the database.