Preparing for Jira 9.3
This documentation is intended for Jira developers who want to ensure that their existing apps are compatible with Jira 9.3
Upgrading from 8.x to 9.x triggers full Jira reindex that causes some downtime during the process. If you’re on 8.x now, make sure you’ve estimated the downtime and set the best time for the upgrade.
Learn more about how to handle full reindex and estimate downtime
Quick info
Latest version
Here you can find information about the latest EAPs.
| Application/Date | number | Version (Maven) | Downloads |
|---|---|---|---|
Jira Core/Software
| 9.3.0-EAP02 | 9.3.0-m0004 | Source files (Core) Source files (Software) |
Jira Service Management
| 5.3.0-EAP02 | 5.3.0-m0004 |
Summary of changes
In this section we'll provide an overview of the changes we intend to make, so you can start thinking how it might impact your apps. Once they're ready, we'll indicate when a change has been implemented, and in which milestone.
Multi-threaded index catch-up (Data Center)
Status: IMPLEMENTED (01)
App: JIRA SOFTWARE
Index catch-up is now performed in multiple threads to increase scalability and speed up the node start-up.
After obtaining a snapshot copy, the node synchronizes it with the changes between the time of snapshot creation and the time of the node start-up. Such synchronization takes time that might hinder the node start-up. But multi-threaded index catch-up prevents this hindrance and, as a result, provides more effective use of computing resources and improves your instance performance.
The feature goes out of the box. Multi-threaded index catch-up launches during start-up, when index snapshot is used, as well as during index recovery from a backup.
Learn more about Jira index snapshots
Higher accuracy of app attribution for database usage
Status: IMPLEMENTED (01)
App: JIRA SOFTWARE
We’ve improved the db.core.executionTime metric for app monitoring by providing new system properties for the Diagnostics plugin:
com.atlassian.diagnostics.db.static.method.invoker.enablewith the valuestrueorfalseatlassian.diagnostics.db.static.method.invoker.improved.accuracy.enablewith the valuestrueorfalse
Enabling the properties allows attributing apps for database usage more accurately and reduces the impact of the operations on the instance performance. You can set the properties before starting Jira or at runtime.
atlassian.diagnostics.db.static.method.invoker.improved.accuracy.enable can be set either together with or independently of com.atlassian.diagnostics.db.static.method.invoker.enable.
com.atlassian.diagnostics.db.static.method.invoker.enable set to true will attribute an app for using the database by identifying a responsible plugin via the stack trace. The stack trace has the following properties:
atlassian.diagnostics.traversal.limit.stack.tracewith the default value20indicates how far into the stack trace to look. A much larger value may affect the performance.atlassian.diagnostics.classname.pluginkey.map.disableset tofalsewill disable the generation of a map of class names to plugin keys. This property helps decide which plugin is which in the stack trace.
atlassian.diagnostics.db.static.method.invoker.improved.accuracy.enable set to true will attribute an app for using the database by deciding which plugin is responsible via the class context.
The class context is similar to the stack trace but more accurate. The class context provides access to the loaded class and not just the class name. Thus, we can see which plugin loaded the class even if multiple plugins have loaded classes with the same names. This method is more efficient than the stack trace.
The class context has the following property: atlassian.diagnostics.traversal.limit.class.context with the default value 10. The property indicates how far into the class context to look. A much larger value may affect the performance.
Learn more about application metrics
Learn more about the Jira diagnostics plugin
New database connectivity metrics available through JMX and log file
Status: IMPLEMENTED (02)
App: JIRA SOFTWARE JIRA SERVICE MANAGEMENT
The new database connectivity metrics allow efficient instance diagnostics and timely resolution of performance issues. The metrics are available through JMX and a new log file atlassian-jira-ipd-monitoring.log.
The log file is available in the {jira_home}\log folder where you can find all the existing log files. The log file is also included in the Support Zip file. If needed, you can generate it in the Atlassian troubleshooting & support tools plugin and send the file to Atlassian Support. Learn more about the plugin
Using database connectivity metrics, you’ll efficiently identify what in your environment or infrastructure might cause the performance issues. Early discovery of a problem guarantees that it can be fixed before its consequences have a bigger impact on instance operation.
To use the metrics, make sure you’ve enabled JMX. Read more about JMX in Jira
The feature is enabled by default.
To disable it:
- Go to
<JIRA_URL>/secure/admin/SiteDarkFeatures!default.jspa, where<JIRA_URL>is the base URL of your Jira instance. - In the Enable dark feature text area, enter
com.atlassian.jira.in.product.diagnostics.disabled. Select Add. Learn how to manage dark features- To re-enable the IPD, in the Site Wide Dark Features panel, find
com.atlassian.jira.in.product.diagnostics.disabledand select Disable.
- To re-enable the IPD, in the Site Wide Dark Features panel, find
Learn more about the new database connectivity metrics
Activity tabs failures fixed
Status: PLANNED (02)
App: JIRA SOFTWARE
We know that after we released the improvements for the Activity tabs with Jira 9.0, there appeared some issues that prevented you from using this feature properly. We investigated the issues and are shipping the fix for the original Jira-related problem that we discovered.
We’ve identified that there may be some issues that are caused outside of Atlassian’s control. We're working with known partners regarding the issues and have identified a path to identify whether proper root cause.
We’ll also provide you with the list of things that you should report to Atlassian Support in case of failures in the Activity tabs. Stay tuned!
Help center column sorting (Data Center)
Status: IMPLEMENTED (01)
App: JIRA SERVICE MANAGEMENT
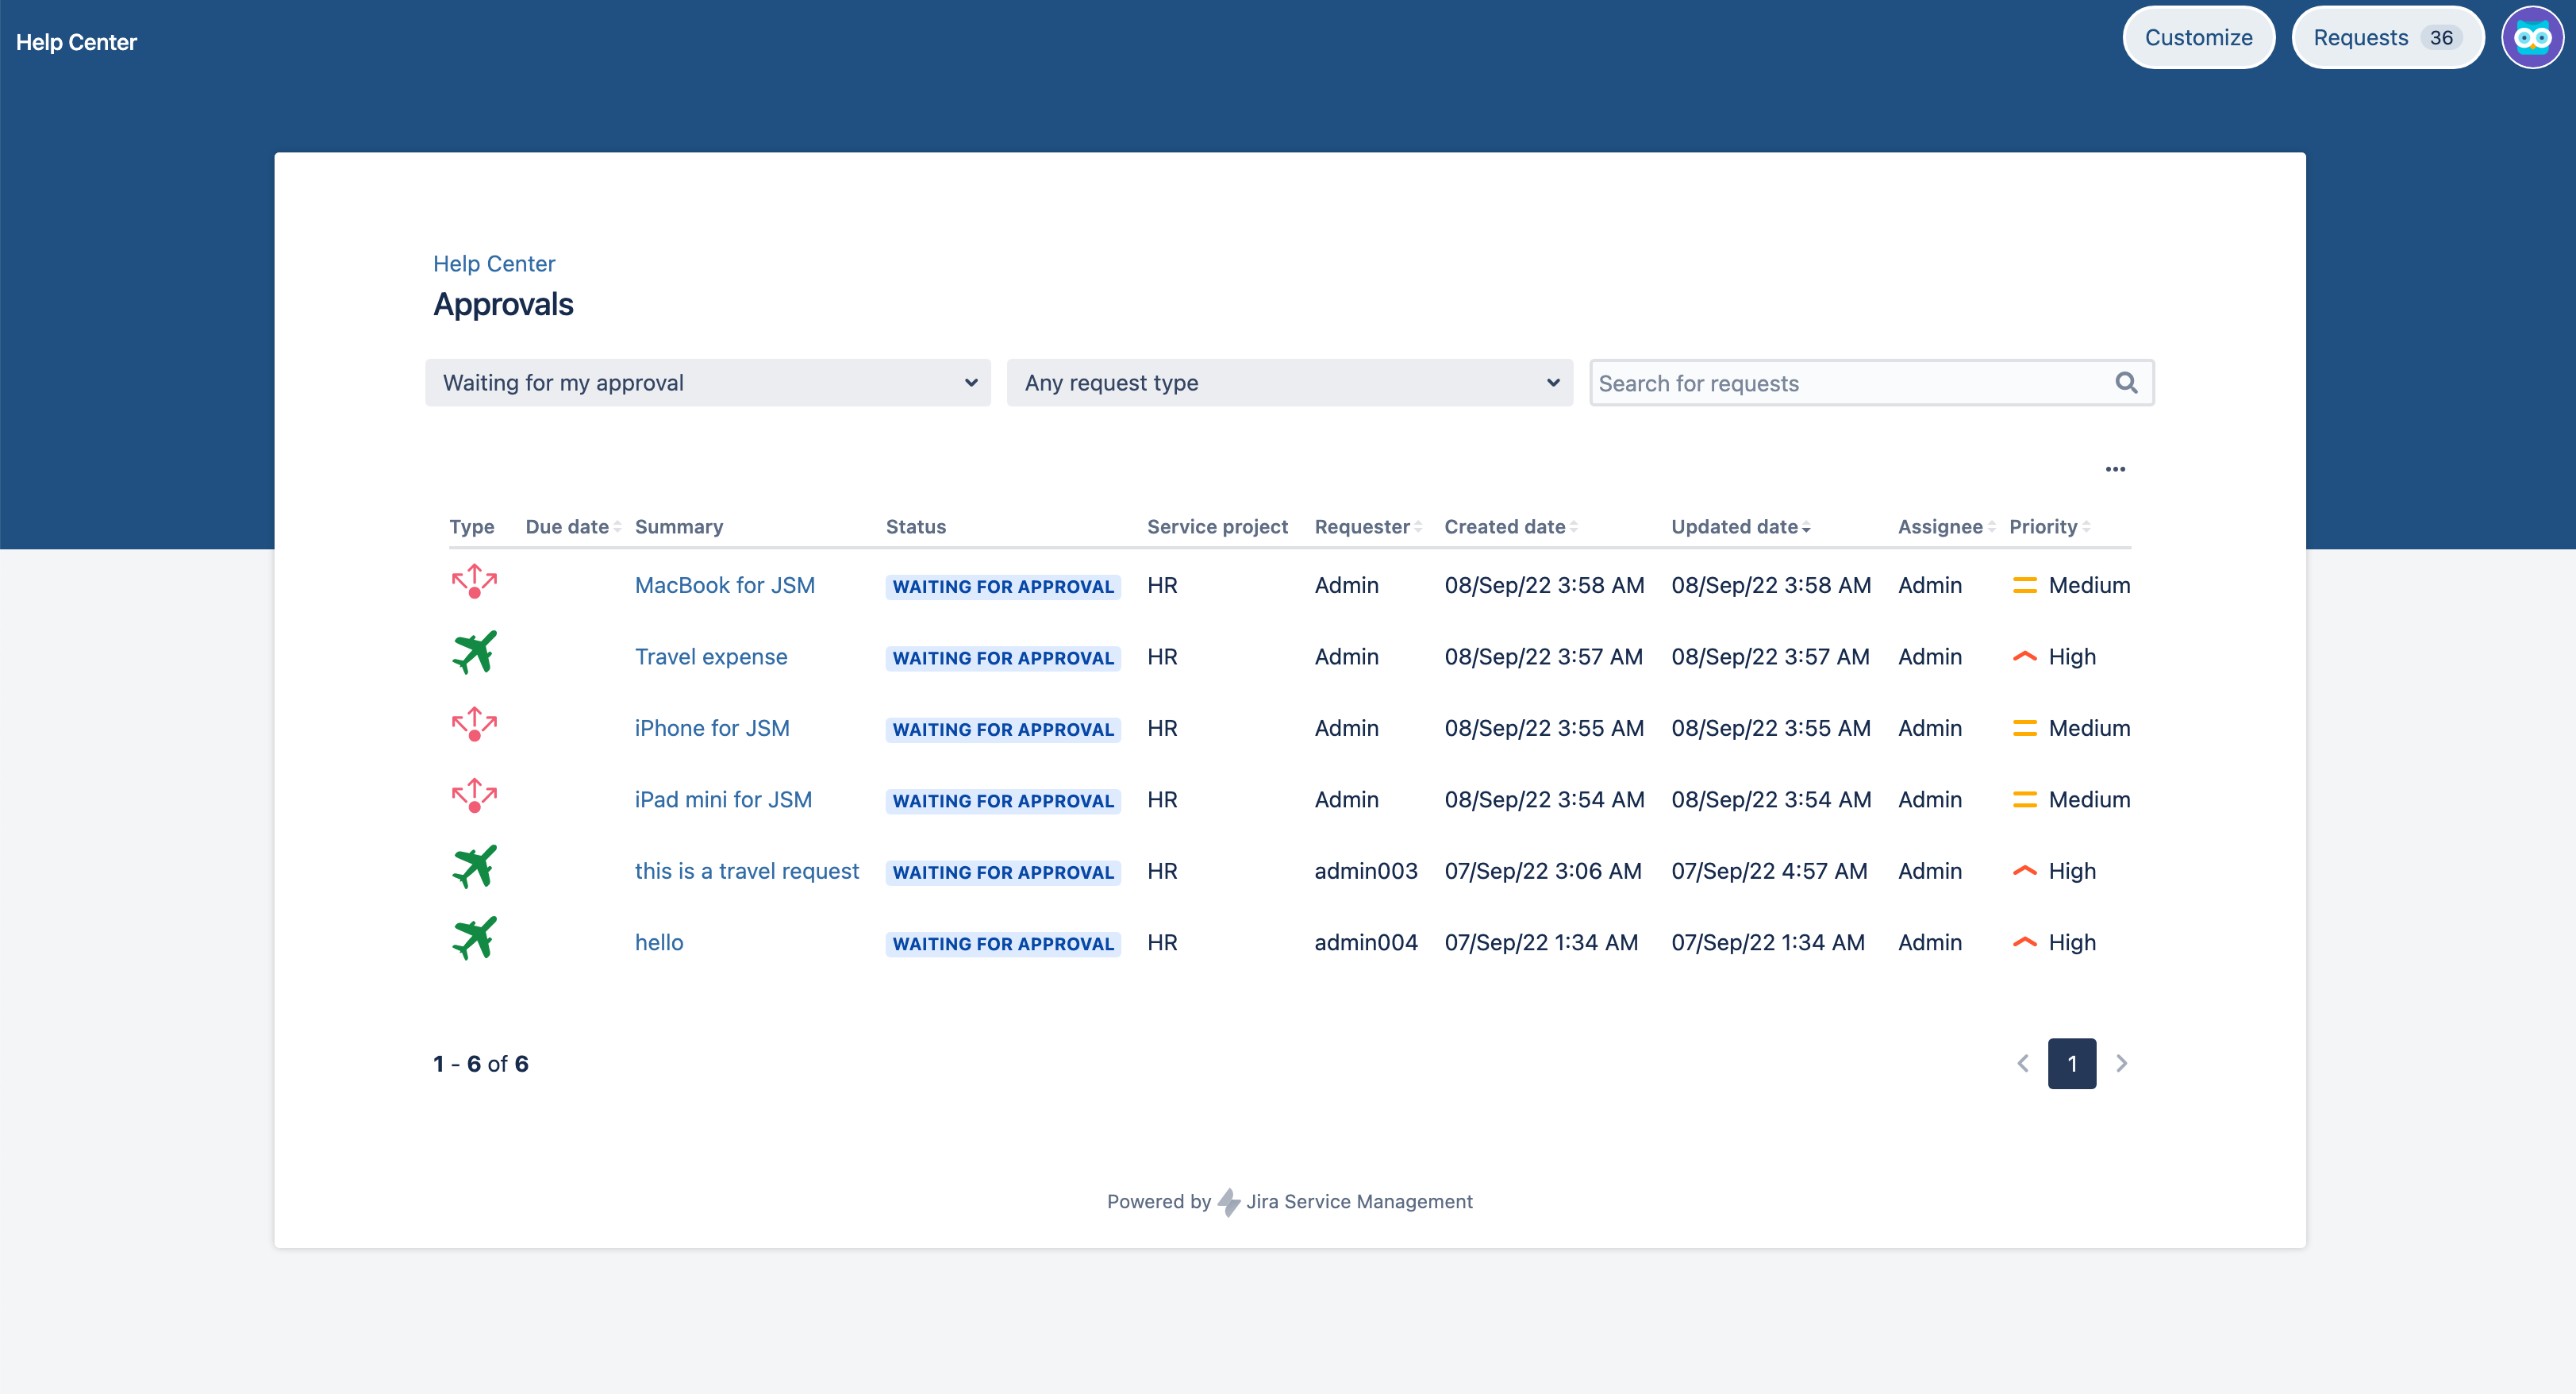
You can now sort columns in ascending and descending order on the My requests page in your help center. This way you can adjust the visualization of the data on the page to your personal preferences, navigate through the data with ease, and find the values you need faster.
Here’s what the help center looks like with the update (the Approvals page).
To sort the column, select its title. To change the sorting order, select the column title again.
Login-free customer portal (Data Center)
Status: IMPLEMENTED (01)
App: JIRA SERVICE MANAGEMENT
All of your customers can now access your customer portal, even those with no account. They can discover other available portals, read help articles, and raise requests without logging in.
This feature is disabled by default. Any action that modifies the global configuration relating to the free-login settings or individual customer permissions will be captured in the audit log.
To enable login-free access to the customer portal, make sure you’ve set up and enabled outgoing mail. To check this, go to Administration > System > Outgoing mail.
To enable login-free access to the whole instance:
- Go to Administration > Applications.
- Under Jira Service Management, select Configuration.
- Under Public signup, for Can customers sign up for an account, and raise requests by email?, select Yes.
- Under Login-free portal, for Can customers raise requests from the help center without logging in?, select Yes.
To allow login-free access to a specific project:
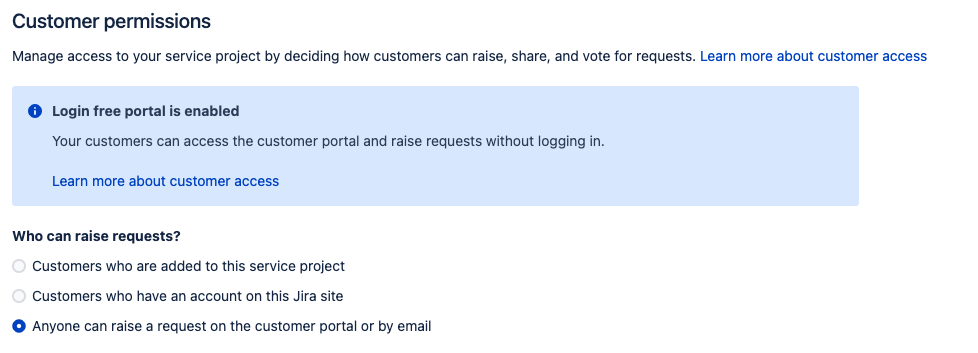
- In your project’s settings, go to Customer permissions.
- For Who can raise requests?, select Anyone can raise a request on the customer portal or by email.
When this feature is enabled, the PortalWebFragmentsResponse context won’t necessarily provide an ApplicationUser. All users with accounts will still have a valid ApplicationUser provided through PortalWebFragmentsResponse, while for anonymous users the User field will be set to null.
Request form fields support
Some fields in request forms aren’t supported with login-free access. If an unsupported field is required in a request form, the user without an account will be asked to create one or log in to continue. Note that custom and third-party fields will be displayed in case of login-free access.
See what fields are unavailable with login-free access:
- Security level
- Approvers
- Labels
- Request participants
- Component/s
- Fix version/s
- Affects version/s
- Environment
- Assets
Insight is now Assets
Status: IMPLEMENTED (01)
App: JIRA SERVICE MANAGEMENT
We’re changing the name of the Jira Service Management asset management tool from Insight to Assets.
The functionality of the tool remains the same. But the rebranding has influenced the user interface and the tool-related marketplace apps, like Insight – Asset Management, Insight Discovery, Insight AWS Integration, and others.
With this rebranding, we aim at:
- Eliminating the confusion between Insight as an asset management tool and Insights as a reporting tool in Jira Service Management.
- Highlighting the purpose and value of the tool specifically for asset and configuration management.
- Providing consistency with Jira Service Management Cloud.
Improvements to accessibility and user interface in Assets
Status: IMPLEMENTED (01)
App: JIRA SERVICE MANAGEMENT
We’ve enhanced the accessibility and user interface of Assets (formerly known as Insight) to provide a better user experience, higher usability, and seamless integration with Jira Service Management.
To upgrade Assets, we’ve used Jira Service Management accessibility standards and patterns. This approach has allowed us to narrow the disparity between the tool and Jira Service Management, and maintain consistency across the product.
The improvements to the accessibility features and user interface cover:
- Building a more empowering and inclusive product
- Improved support for the use of screen readers and keyboard
- Fixing issues with the user interface that create blockers in functionality
- Upgrading the design and content
Batching Assets database queries
Status: IMPLEMENTED (02)
App: JIRA SERVICE MANAGEMENT
Database queries executed during imports to Assets (formerly known as Insight) are now batched to improve the health of your Jira instance and overall import performance. Batching means that all data for each query is retrieved at once, instead of many individual select queries.
This feature impacts imports from all sources by optimizing the executing database queries to batch them together for an object where this is possible.
Enable database query batching to see how your Jira’s performance will grow:
- Batch queries will save the history data.
- The delete operations will be batched up instead of being done one by one for attribute values.
- The insert and update operations will be batched up not to execute one query for every attribute change.
The batching of deletes of objects, attributes, and values is enabled by default. So are optimizations for creating, updating, and deleting attributes.
Assets import offloading to the disk
Status: IMPLEMENTED (02)
App: JIRA SERVICE MANAGEMENT
In Assets (formerly known as Insight), Ehcache is now used to reduce memory consumption during imports and prevent process or machine crashes. This is possible since Ehcache allows for offloading large in-memory objects, created or used during imports, to the disk.
So, now there’s additional disk caching executed during an Assets import to offload large objects from the memory onto the machine’s disk. This practically means creating alternative disk-backed versions of existing common data structures, such as queues and hashmaps, that are heavily used during an import.
What do I need to know?
Here’s what you should know about the specifics of the feature.
- Types of caches
There are two types of disk-based data structures:- Queues replace the existing queue that holds all the objects to be processed. Queues use JSON files under the hood.
- Maps are key-value lookups that replace various hashmaps in imports. Maps use the Ehcache library under the hood.
- Performance
Offloading data to the additional disk might add some extra time to the total duration of an import. But this amount of time is insignificant compared to the database operation time and doesn’t impact the results of the import. - Hardware
The process will be faster if you’re using the disk cache on a disk that is local to your machine, rather than over a network. Also, using spinning hard drives could impact the performance due to their relatively long seek times compared to SSDs.
How to enable and configure the feature?
To enable the feature:
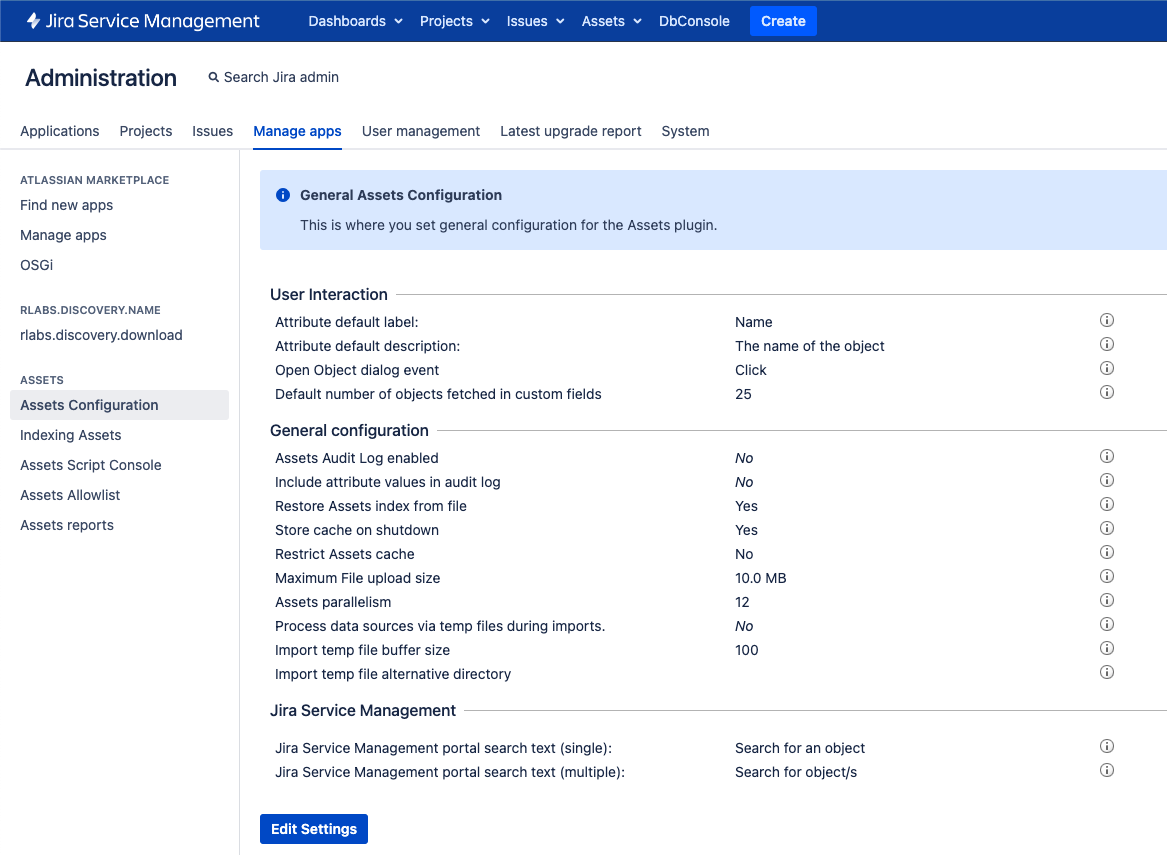
- Go to Administration > Manage apps.
- Under Assets, select Asset configuration.
- For Process data sources via temp files during imports, change the value to Yes.
Also, there are two more options that you can control:
Import temp file buffer size
The number of items that the queue caches keep in memory before writing to disk and while reading to disk. The optimal maximum value is100. The minimal value is1.Import temp file alternative directory
Optionally, specify your own alternative directory where the temporary cache files can be stored. If you set the directory, you should restart the app.
Jira Mobile
Also, in this EAP release, we’re introducing new features to the mobile versions of Jira Software and Jira Service Management. Make sure you have your mobile apps updated.
Attachments upload
Status: IMPLEMENTED
App: JIRA SOFTWARE JIRA SERVICE MANAGEMENT ANDROID 0.28
If using Android, you can now attach images, documents, and other files to issues in Jira and Jira Service Management.
Select a recently accessed instance from the single list
Status: IMPLEMENTED
App: JIRA SOFTWARE JIRA SERVICE MANAGEMENT ANDROID 0.28 APPLE 1.35
If you want to go to a recently accessed instance, you no longer have to enter its URL manually.
On the login screens of Jira and Jira Service Management, you’ll see the list of instances you’ve been to recently. The list includes up to five of your instances. Just select the one you need.
Supporting the Security field
Status: IMPLEMENTED
App: JIRA SOFTWARE JIRA SERVICE MANAGEMENT ANDROID 0.29 APPLE 1.34
We now support the display and editing of issues with the Security field.


