Best practices for performance troubleshooting tools
Platform notice: Server and Data Center only. This article only applies to Atlassian products on the Server and Data Center platforms.
Support for Server* products ended on February 15th 2024. If you are running a Server product, you can visit the Atlassian Server end of support announcement to review your migration options.
*Except Fisheye and Crucible
Problem
This best practice guide is for sysadmins who are looking to gain a clearer view of what's happening in their instances and get the most out of Atlassian Support. We will describe what we consider the best tools for monitoring and analyzing diagnostic data produced by Atlassian products and show you the best way of getting this information to the Atlassian Support team. This guide is segmented by the diagnostic artifact that is produced, and goes into detail on which tool is recommended and how to best use this tool.
The KB articles linked in this document may refer to a specific product, but the techniques described are universal.
Below is a rough guide to when these tools are most likely to be of use, based on the problem you are experiencing.
Whole instance is slow
Thread Dumps, Garbage Collection Logs, Database Profiling, CPU Profiling, Disk Speed, Access Logs, Page (Application) Profiling
Whole instance is unresponsive
Thread Dumps, Garbage Collection Logs, Database Profiling, CPU Profiling, Disk Speed, Access Logs, Page (Application) Profiling
Specific functions in the application are slow
Thread Dumps, Garbage Collection Logs, Database Profiling, CPU Profiling, Client Side Diagnostics, Page (Application) Profiling
Application server is overloaded (but database server appears fine)
Thread Dumps, Garbage Collection Logs, CPU Profiling, Disk Speed, Access Logs, Page (Application) Profiling
Database server is overloaded (but application server appears fine)
Thread Dumps, Database Profiling
OutOfMemory errors or high memory usage
Heap Dump, Garbage Collection Logs
Tools
Thread dumps
When to generate thread dumps
Thread dumps are the most useful tool for investigating performance problems. If an instance is slow or experiencing outages, a thread dump give us a snapshot of what is going on in the instance at exactly that time. A sequence of thread dumps allows us to look at what is going on in over time in an instance. A thread dump reveals if there is some performance issue with the application code itself, which is most often where performance issues are found. Thread dumps also often reveal what other diagnostic artifacts are required.
There's no hard and fast rule as to the quantity and timing of thread dumps that should be created, but as long as they are taken at regular intervals over a period when the instance is performing poorly, they will be useful. For example, a total of 6 thread dumps, one taken every 30 seconds is a common format used in Atlassian Support.
Which tool to use
For generating thread dumps, please follow the instructions in Generating a Thread Dump. We recommend using the method in Troubleshooting Jira performance with Thread dumps if using Linux, as the output of the CPU % can be correlated to a thread.
For processing thread dumps, The Atlassian Support team uses and recommends TDA.
TDA can be used to identify long running threads, lock congestion or contention and get an overall understanding of what the threads of an instance are doing.
Heap Dumps
When to generate a heap dump
A heap dump is useful when the instance is running out of memory and the common causes have already been addressed. A heap dump gives us a breakdown of all the objects that exists in the java heap at the time it was taken. It's important to lower the size of the heap as much as possible before creating a heap dump, as a very large heap can make it harder to analyse as significant resources are required for large heap dumps. A heap dump can also be useful in conjunction with garbage collection logs.
Which tool to use
For generating heap dumps, please follow the instructions in Generating a Heap Dump. Heap dumps can be configured to be automatically generated when an instance runs out of memory, or can be run manually. However, if a heap dump is not generated when an OutOfMemoryError is thrown, it is generally not at all useful.
For processing heap dumps, The Atlassian Support team uses and recommends Eclipse MAT.
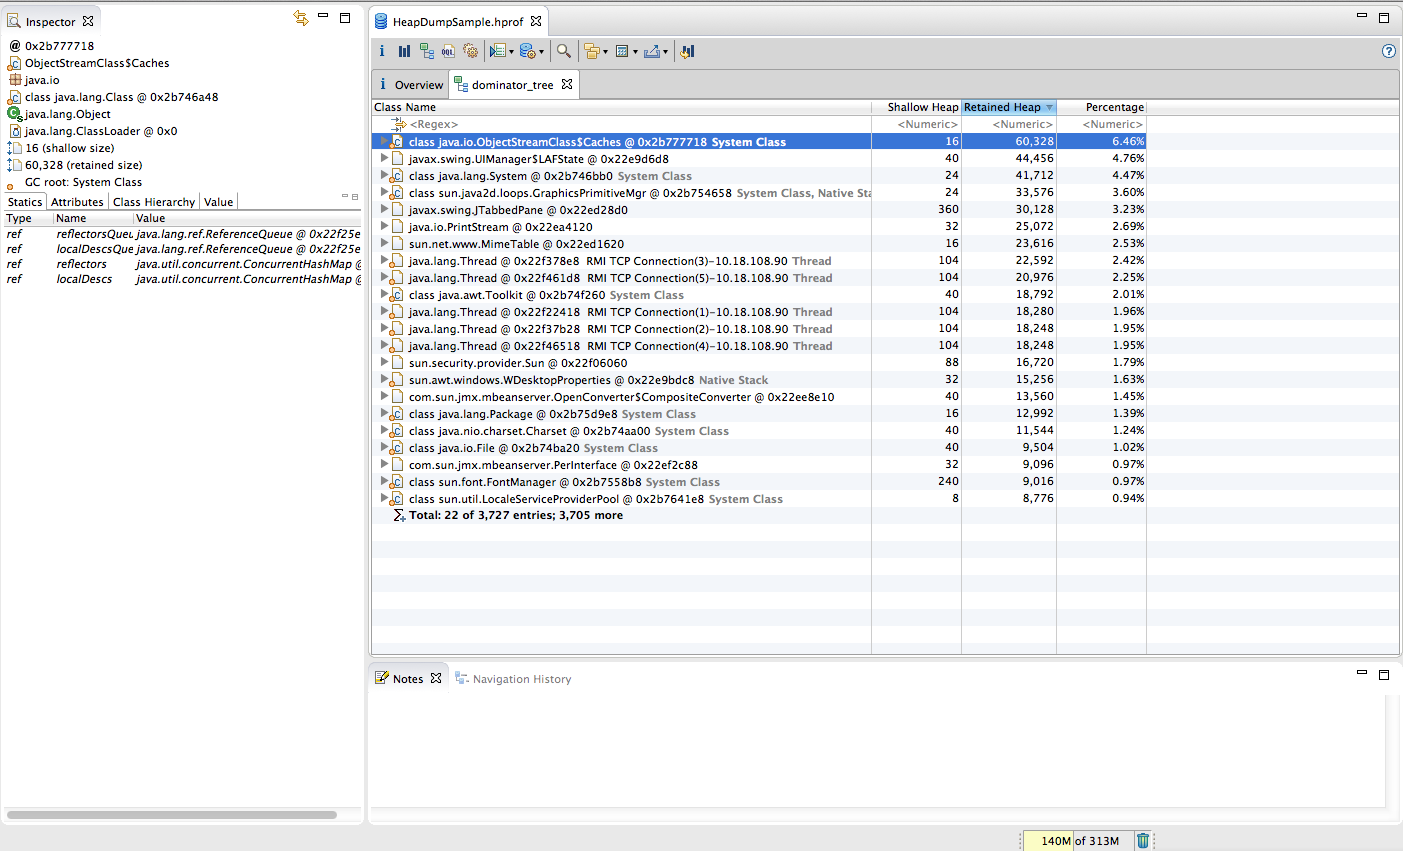
Eclipse MAT's dominator tree - right clicking on a thread and selecting Java Basics > Thread Stacks on the threads that are using the largest amount of heap will quickly and easily let you see the stack trace of that thread. More information can be found in the MAT Documentation.
Garbage Collection (GC) Logs
When to generate GC logs
Is Confluence becoming completely unresponsive for a while, and then recovering without any changes being made? General slowness that hasn't been attributed to the code itself (via thread dumps)? Perhaps the instance is consuming too much memory. If any of the above, you may be experiencing garbage collection problems. Our Garbage Collection (GC) Tuning Guide provides expansive detail on this, but in brief, the three performance goals of garbage collection is to affect the following:
- Reduce Latency - Pauses induced by the JVM as it performs GC
- Improve Throughput - The percentage of clock time the JVM has available for the actual application
- Reduce Footprint - The heap size
Which tool to use
To generate GC logs, please follow the instructions in How to Enable Garbage Collection (GC) Logging.
For processing GC logs, Atlassian Support uses and recommends GCViewer.
GCViewer displaying some partial GCs over the first minute after startup. For information on what the lines mean, click the View menu button.
Database Profiling
When to use database profiling
Is the CPU of your database server maxing out, but your application's server running normally? Does a thread dump reveal that there are many long running threads waiting for a connection to the database? If so, we can use database profiling to examine where time is spent during query execution in the database.
Which tool to use
See CPU profiling tools below. Additionally JProfiler can be used as detailed in Use jProfiler to analyse Jira application performance.
CPU Profiling
When to use CPU profiling
Running the 'top' command shows high CPU usage on the application server, and Confluence is running slowly. This is often used in conjunction with thread dumps to examine which part of the thread dump is consuming the CPU.
Which tool to use
There are many options available here. This may depend on what your company already has configured, but some good options are:
For Linux based instances, Troubleshooting Jira performance with Thread dumps includes a method of generating CPU profiling information without any paid tools.
JProfiler in action - here we can see that the permission checking is the most expensive CPU operation that was profiled.
Client Side Diagnostics
When to check the client side information
If your application is seeing performance issues, but it isn't attributable to the backend (as diagnosed by other tools such as thread dumps) it's useful to get information from your browser. Namely, the network information, and console logs, to look for any errors in the front end.
Which tool to use
Any browser's developer tools are capable of providing the information required, but Atlassian Support prefers Chrome due to the Chrome HAR viewer. This depends upon how the information is generated - different browsers have different means as in Generate HAR files and analyze web requests for Atlassian support.
How to generate client side diagnostic information
- Open the Chrome developer toolbar (Right click on any empty space of chrome window, choose *Inspect Element* or see other way of opening the tool at this page).
- Go to the Network tab (see example here). Clear all the existing text in the Network tab if there's any by clicking the remove icon next to the red circle icon at top right corner of the developer tool window.
- Perform whichever operation is slow.
- There will be some requests logged into the network window. Save this information to a HAR file. Instructions for this.
- Also open the *console tab* to see if there is any errors in the output (how to work with the console).
- Save the text outputted by the console to a file.
At the end of this we should have 2 files: 1 HAR file for the network request and 1 log file of the console output.
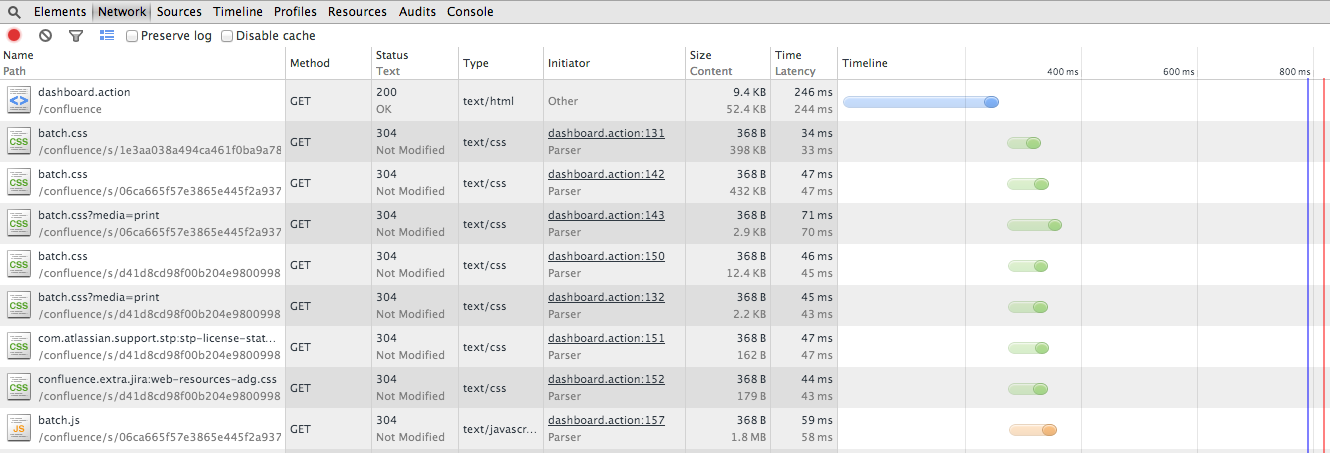
The information the Chrome network tab captured as I loaded the dashboard of Confluence
Proxy bypassing
Slowness issues with some specific Confluence functionality can sometimes be caused by problems with the instance's configured proxy.
To troubleshoot this, it's recommended to try bypassing the proxy, by accessing Confluence directly through the server's IP address.
This can be done through either of these methods, depending on how the current network structure is configured:
- How to bypass a proxy to test network connectivity
- How to bypass a reverse proxy or SSL in Application Links
While performing this test, it's often useful to generate another HAR file, as described above, to compare details between the two sets of proxied and non-proxied network requests.
Disk Speed
When to check the disk speed
If your application is slow and the following areas in of the application in particular are performing poorly, then it's advisable to check disk speed:
- Reindexing
- Searching
- Attachments
- The Issue Navigator (in JIRA)
Access Logs
When to check the access logs
Access logs are a great way of seeing general patterns in the usage of an instance. It can be a good way of finding if a particular REST endpoint is being heavily accessed, or if there is some automation causing too many requests.
Enabling access logs
For JIRA: User Access Logging
For Fisheye/Crucible: Enabling Access Logging In Fisheye
For Confluence: How to Enable User Access Logging
For Bitbucket Server: N/A (always on)
Which tool to use
For JIRA: Jira Access Log Analyzer
For Bitbucket Server (formerly known as Stash): Atlassian Stash and Bitbucket Server access log parser
Page Profiling
When to use page profiling
If a particular page or piece of functionality is performing poorly, page profiling can be used to help determine which method is responsible for this slowness, by displaying the time taken to execute each method. For general slowness, other methods are more useful.
Which tool to use
This is an built-in tool for JIRA and Confluence.
- For Confluence: Troubleshooting Slow Performance Using Page Request Profiling
- For JIRA: JIRA - Profiling
The General Configuration page of Confluence Admin


