Live Monitoring Using the JMX Interface

On this page

Still need help?

The Atlassian Community is here for you.

Ask the community

JMX (Java Management Extensions API) allows you to monitor the status of your Confluence instance in real time. JMX uses objects called MBeans (Managed Beans) to expose data and resources from your application, providing useful data such as the resource usage of your instance and its database latency, allowing you to diagnose problems or performance issues.

On this page, we'll guide you through how to use JConsole to monitor Confluence locally and remotely. JConsole is included in the Java Development Kit (JDK), but you can use any JMX client.

This page also contains information about In-product diagnostics available through JMX.

This guide provides a basic introduction to the JMX interface and is provided as is. Our Support team can help you troubleshoot a specific Confluence problem, but aren't able to help you set up your monitoring system or interpret the results.

Monitor Confluence using JMX

Monitor Confluence remotely using your APM

To monitor Confluence in your Application Performance Monitoring (APM) tool, you'll need to install a JMX exporter to transform theJMX MBeans into the right format for your tool. See Monitor application performance to find out how to do this. 

If you don't have an Application Performance Monitoring (APM) system, we've created a guide to get you started with Prometheus and Grafana, including some template dashboards that you can use as a jumping off point. See Monitor Confluence with Prometheus and Grafana.

Monitor Confluence remotely using JConsole

Remote monitoring is recommended for production systems, as it does not consume resources on your Confluence server.

To monitor remotely:

  1. Add the following properties to your setenv.sh / setenv.bat file. The port can be any port that is not in use.

    set CATALINA_OPTS=-Dcom.sun.management.jmxremote %CATALINA_OPTS%
    set CATALINA_OPTS=-Dcom.sun.management.jmxremote.port=8099 %CATALINA_OPTS%
  2. Decide how you will secure your remote connection. See Remote Monitoring and Management for more information. 
    Although it is possible to disable authentication, we do not recommend doing this on a production system.

  3. Start JConsole (you'll find it in the bin directory of the JDK installation directory).
  4. Select Remote Process.
  5. Enter your hostname and port (this is the port you specified earlier, not the Confluence port).
  6. Click Connect.

See Using JConsole for more information on remote monitoring.

Monitor Confluence locally using JConsole

If you are troubleshooting a particular issue, or only need to monitor Confluence for a short time, you can use local monitoring. Local monitoring can have a performance impact on your server, so its not recommended for long-term monitoring of your production system.

To monitor locally:

  1. Start JConsole (you'll find it in the bin directory of the JDK installation directory)

  2. Select Local Process.
  3. Select the Confluence process. It will be called something like org.apache.catalina.startup.Bootstrap start

See Using JConsole for more information on local monitoring.

Write JMX metrics to a log file

You can also choose to write the following JMX metrics to a log file. This is useful when you are troubleshooting a problem.

  • CacheStatistics
  • IndexingStatistics
  • MailTaskQueue
  • RequestMetrics
  • SystemInformation
  • ThreadPool
  • OS
  • GC
  • Threading
  • TomcatManager
  • RequestProcessor

To write JMX metrics to a log file:

  1. Go to Administration  > General Configuration > Scheduled jobs
  2. Enable the Log JMX Metrics job. 

This job runs once per minute by default, and writes metrics to the <local-home/logs/atlassian-confluence-jmx.log file. See Working with Confluence Logs

Disable JMX monitoring

To diable JMX monitoring:

  1. Go to Administration  > General Configuration > Monitoring.
  2. Deselect JMX monitoring.

This will also disable App monitoring, as it requires JMX to be enabled. 

Confluence MBeans

You can use the following Confluence MBeans to see live information about your Confluence instance.

CacheStatistics

This MBean shows information about Confluence caches. This info can also be found on the Cache Statistics page.

IndexingStatistics

This MBean shows information related to search indexing. Here's some useful attributes.

Property name

Function

Values

Flushing

Indicate whether the cache is currently flushing

True/False

LastElapsedMilliseconds

Time taken during last indexing

Milliseconds

TaskQueueLength

Shows number of tasks in the queue

Integer

ReIndexing Indicates whether Confluence is currently reindexingTrue/False

SystemInformation

This MBean shows information such as the Confluence version and uptime. This info can also be found on the System Information page.  

Property name

Function

Values

DatabaseExampleLatency

Shows the latency of an example query performed against the database

Milliseconds

RequestMetrics

This MBean shows information related to system load and error pages served.

Property name

Function

Values

AverageExecutionTimeForLastTenRequests

Average execution time for the last ten requests.

Milliseconds

CurrentNumberOfRequestsBeingServed

Number of requests being served at this instant.

Integer

ErrorCount

Number of times the Confluence error page was served.

Integer

NumberOfRequestsInLastTenSeconds

The number of requests in the last ten seconds.

Integer

MailServer-SMTPServer

This MBean shows information related to email dispatch attempts and failures. There will be an MBean for every SMTP Mailserver that has been configured in the Confluence instance.

Property name

Function

Values

EmailsAttempted

The number of email messages Confluence has tried to send.

Integer

EmailsSent

The number of email messages sent successfully.

Integer

MailTaskQueue

This MBean shows information related to the email workload.

Property name

Function

Values

ErrorQueueSize

Number of errors in the queue.

Integer

Flushing

Shows state (i.e. flushing, or not)

True/False

FlushStarted

Time that operation began.

Time

RetryCount

The number of retries that were performed.

Integer

TaskSize

Number of email messages queued for dispatch.

Integer

SchedulingStatistics

This MBean shows information related to current jobs, scheduled tasks and the time that they were last run.

Property nameFunctionValues
AllJobNamesShows information on current scheduled jobs including the time they were last runString
CurrentlyRunningJobNamesLists the scheduled jobs that are currently runningList

App-specific metrics

Enable app monitoring to expose additional metrics that are useful when troubleshooting issues with Marketplace and custom-built apps. 

See App metrics reference for a full list of app-specific metrics.

Additional MBeans

To also monitor Hibernate and Hazelcast (Confluence Data Center only) you will need to add the following properties to your setenv.sh / setenv.bat file first. 

set CATALINA_OPTS=-Dconfluence.hazelcast.jmx.enable=true %CATALINA_OPTS%
set CATALINA_OPTS=-Dconfluence.hibernate.jmx.enable=true %CATALINA_OPTS%

This will make the Hibernate and Hazelcast MBeans available in your JMX client. 

Monitoring high CPU consuming threads

The Top Threads Plugin for JConsole is useful for monitoring whether the CPU is spiking. Use the following command to start JConsole with this plugin:

JConsole -pluginpath /pathto/topthreads.jar

In-product diagnostics available through JMX

We've introduced a set of database connectivity, HTTP connection, and indexing metrics for in-product diagnostics available through JMX.

In-product diagnostics (IPD) provides greater insights for you and our Support into how running instances are operating.

IPD uses additional metrics handling Confluence’s interactions with its database. For example, by using database connectivity metrics, you’ll efficiently identify what in your environment or infrastructure might cause the performance issues. 

The feature is enabled by default. Live metrics are available in the following formats:

  • as new JMX MBeans

  • as a history of snapshots of the JMX values in the new IPD log file atlassian-confluence-ipd-monitoring.log

The log file is also included in the Support Zip file created in the Atlassian Troubleshooting and Support app. If needed, send the zip file to Atlassian Support who has the internal tools to interpret it.

The log file is available in the {confluence_home}\logs folder where you can find all the existing log files. The log file is also included in the Support Zip file created in the ATST plugin. If needed, you can generate the Support Zip file in the Atlassian troubleshooting & support tools plugin and send the file to Atlassian Support, where we have internal tools to interpret it. Learn more about the plugin

Communication

The feature communicates in the following ways:

  • JMX: JMX MBeans are updated periodically based on an internal schedule.

  • The log file atlassian-confluence-ipd-monitoring.log: JMX values are snapshotted and recorded to the log file on a configurable schedule. By default, the JMX values are polled and written to the log file every 60 seconds.

In-product diagnostics metrics

Expand the following sections to learn more about the metrics available for in-product diagnostics.

To use the metrics, make sure you’ve first enabled JMX.

Database connectivity metrics

MBean ObjectName

Metric description

com.atlassian.confluence:type=metrics,
category00=db,category01=connection,
category02=latency,name=value

  • db.connection.latency.value

The latest measure of latency when querying the database

Set to -1 when database connectivity is lost

com.atlassian.confluence:type=metrics,
category00=db,category01=connection,
category02=latency,name=statistics

  • db.connection.latency.statistics

Aggregated statistics of latency since the last restart

com.atlassian.confluence:type=metrics,
category00=db,category01=connection,
category02=pool,category02=numActive,
name=statistics

  • db.connection.pool.numActive.statistics

Aggregated statistics of the number of active connections in the database connection pool since the last restart

com.atlassian.confluence:type=metrics,
category00=db,category01=connection,
category02=pool,category02=numActive,
name=value

  • db.connection.pool.numActive.value

The latest measure of the number of active connections in the database connection pool.

Set to -1 when database connectivity is lost

com.atlassian.confluence:type=metrics,
category00=db,category01=connection,
category02=pool,category02=numIdle,
name=statistics

  • db.connection.pool.numIdle.statistics

Aggregated statistics of the number of idle connections in the database connection pool since the last restart

com.atlassian.confluence:type=metrics,
category00=db,category01=connection,
category02=pool,category02=numIdle,
name=value

  • db.connection.pool.numIdle.value

The latest measure of the number of idle connections in the database connection pool.

Set to -1 when database connectivity is lost

com.atlassian.confluence:type=metrics,
category00=db,category01=connection,
category02=state,name=value

  • db.connection.state.value

The latest indicator, 0 for a failed connection or 1 for a working connection, of the state of the connection to the database

com.atlassian.confluence:type=metrics,
category00=db,category01=connection,
category02=failures,name=counter

  • db.connection.failures.counter

The count of database connection failures since the last restart

HTTP connection metrics

Bean ObjectName

Metric description

com.atlassian.confluence:type=metrics,
category00=http,category01=connection,
category02=pool,category03=numActive,
name=value

  • http.connection.pool.numActive.value

The latest measure of the number of active connections in the HTTP connection pool. If more than one pool is defined, the sum of active connections from all pools is returned.

com.atlassian.confluence:type=metrics,
category00=http,category01=connection,
category02=pool,category03=numIdle,
name=value

  • http.connection.pool.numIdle.value

The latest measure of the number of idle connections in the HTTP connection pool. If more than one pool is defined, the sum of idle connections from all pools is returned.

com.atlassian.confluence:type=metrics,
category00=http,category01=connection,
category02=pool,category03=numMax,
name=value

  • http.connection.pool.numMax.value

The maximum number of threads to be created by the HTTP connectors and made available for requests.

com.atlassian.confluence:type=metrics,
category00=http,category01=connection,
category02=sessions,category03=active,
name=value

  • http.connection.sessions.active.value

The latest measure of the number of active user sessions

com.atlassian.confluence:type=metrics,
category00=http,category01=connection,
category02=sessions,category03=active,
name=statistics

  • http.connection.sessions.active.statistics

Aggregated statistics of the number of active user sessions

com.atlassian.confluence:type=metrics,
category00=http,category01=connection,
category02=sessions,category03=recent,
name=value

  • http.connection.sessions.recent.value

The latest measure of the number of recent user sessions. Recent session is the session that has been active in the last one hour

com.atlassian.confluence:type=metrics
category00=http,category01=requests,
name=value

  • http.requests.value

The latest measure of the total number of HTTP requests per minute

com.atlassian.confluence:type=metrics,
category00=http,category01=requests,
name=statistics

  • http.requests.statistics

Aggregated statistics of the total number of HTTP requests per minute

Indexing metrics
Bean ObjectNameMetric description
com.atlassian.confluence:type=metrics,
category00=index,category01=rebuild,
category02=totaltimemillis,name=value
  • com.atlassian.confluence.metrics.
    index.rebuild.totaltimemillis.value

The duration of full reindexing. For multiple nodes, metrics are emitted only on the node where the reindexing is taking place.

com.atlassian.confluence:type=metrics,
category00=index,category01=rebuild,
category02=totaltimemillis,
name=statistics
  • com.atlassian.confluence.metrics.
    index.rebuild.totaltimemillis.statistics

Aggregated statistics of the duration of full reindexing

com.atlassian.confluence:type=metrics,
category00=index,category01=queue,
category02=size,name=value,
tag.queueName=main
  • com.atlassian.confluence.metrics.
    index.queue.size.value


tag.queueName: main

The number of items left in the main queue. The increasing number of items left in the main queue might indicate that more items are being added to the queue than processed within the same period of time.

com.atlassian.confluence:type=metrics,
category00=index,category01=queue,
category02=size,name=value,
tag.queueName=change
  • com.atlassian.confluence.metrics.
    index.queue.size.value

tag.queueName: change

The number of items left in the change queue. The increasing number of items left in the change queue might indicate that more items are being added to the queue than processed within the same period of time.

com.atlassian.confluence:type=metrics,
category00=index,category01=queue,
category02=size,name=value,
tag.queueName=edge
  • com.atlassian.confluence.metrics.
    index.queue.size.value

tag.queueName: edge

The number of items left in the edge queue. The increasing number of items left in the edge queue might indicate that more items are being added to the queue than processed within the same period of time.

com.atlassian.confluence:type=metrics,
category00=index,category01=queue,
category02=batches,
category03=processingTimeMillis,
name=value,tag.queueName=change
  • com.atlassian.confluence.metrics.
    index.queue.batches.processingTimeMillis.
    value

tag.queueName: change

The latest measure of the total processing time of all batches during the IPD measurement interval for the change queue.

The default IPD measurement interval is one minute.

com.atlassian.confluence:type=metrics,
category00=index,category01=queue,
category02=batches,
category03=processingTimeMillis,
name=value,tag.queueName=edge
  • com.atlassian.confluence.metrics.
    index.queue.batches.processingTimeMillis.
    value

tag.queueName: edge

The latest measure of the total processing time of all batches during the IPD measurement interval for the edge queue.

The default IPD measurement interval is one minute.

com.atlassian.confluence:type=metrics,
category00=index,category01=queue,
category02=batches,
category03=processingTimeMillis,
name=value,tag.queueName=main
  • com.atlassian.confluence.metrics.
    index.queue.batches.processingTimeMillis.
    value

tag.queueName: main

The latest measure of the total processing time of all batches during the IPD measurement interval for the main queue. The main index queue is also known as the content Index queue.

The default IPD measurement interval is one minute.

com.atlassian.confluence:type=metrics,
category00=index,category01=queue,
category02=batches,
category03=processingTimeMillis,
name=statistics,tag.queueName=change

com.atlassian.confluence.metrics.
index.queue.batches.
processingTimeMillis.statistics

tag.queueName: change

Aggregated statistics of the batch processing time for the change queue.

com.atlassian.confluence:type=metrics,
category00=index,category01=queue,
category02=batches,
category03=processingTimeMillis,
name=statistics,tag.queueName=edge
  • com.atlassian.confluence.metrics.
    index.queue.batches.
    processingTimeMillis.statistics

tag.queueName: edge

Aggregated statistics of the batch processing time for the edge queue.

com.atlassian.confluence:type=metrics,
category00=index,category01=queue,
category02=batches,
category03=processingTimeMillis,
name=statistics,tag.queueName=main
  • com.atlassian.confluence.metrics.
    index.queue.batches.
    processingTimeMillis.statistics

tag.queueName: main

Aggregated statistics of the batch processing time for the main queue.

com.atlassian.confluence:type=metrics,
category00=index,category01=queue,
category02=items,category03=added,
name=custom,tag.queueName=change
  • com.atlassian.confluence.metrics.
    index.queue.items.added.custom

tag.queueName: change

The number of items added to the change queue within one minute.

com.atlassian.confluence:type=metrics,
category00=index,category01=queue,
category02=items,category03=added,
name=custom,tag.queueName=edge
  • com.atlassian.confluence.metrics.
    index.queue.items.added.custom

tag.queueName: edge

The number of items added to the edge queue within one minute.

com.atlassian.confluence:type=metrics,
category00=index,category01=queue,
category02=items,category03=added,
name=custom,tag.queueName=main
  • com.atlassian.confluence.metrics.
    index.queue.items.added.custom

tag.queueName: main

The number of items added to the main queue within one minute.

com.atlassian.confluence:type=metrics,
category00=index,category01=queue,
category02=items,category03=processed,
name=custom,tag.queueName=change
  • com.atlassian.confluence.metrics.
    index.queue.items.processed.custom

tag.queueName: change

The number of items from the change queue processed within one minute.

com.atlassian.confluence:type=metrics,
category00=index,category01=queue,
category02=items,category03=processed,
name=custom,tag.queueName=edge
  • com.atlassian.confluence.metrics.
    index.queue.items.processed.custom

tag.queueName: edge

The number of items from the edge queue processed within one minute.

com.atlassian.confluence:type=metrics,
category00=index,category01=queue,
category02=items,category03=processed,
name=custom,tag.queueName=main
  • com.atlassian.confluence.metrics.
    index.queue.items.processed.custom

tag.queueName: main

The number of items from the main queue processed within one minute.

Infrastructure metrics
MBean ObjectNameMetric description
Cluster metrics
com.atlassian.confluence:type=metrics,
category00=node,category01=latency,
name=statistics,tag.destNode=<nodeId>

node.latency.statistics
destNode=<nodeId>

  • Aggregated statistics of communication latency to the node (<nodeId>).

  • There's a metric for all cluster nodes except for itself.

com.atlassian.confluence:type=metrics,
category00=node,category01=connection,
category02=state,name=custom,
tag.destNode=<nodeId>

node.connection.state.custom
destNode=<nodeId>

  • The state of communication with another node (<nodeId>).

  • There's a metric for all cluster nodes except for itself

Mail server metrics
com.atlassian.confluence:type=metrics,
category00=mail,category01=outgoing,
category02=connection,category03=state,
name=custom

mail.outgoing.connection.state.custom

  • The state of connection to an outgoing SMTP mail server.

  • The metric is available if the SMTP server is configured.

com.atlassian.confluence:type=metrics,
category00=mail,category01=incoming,
category02=connection,category03=state,
name=custom,tag.serverName=<mailName>

mail.incoming.connection.state.custom
serverName=<mailName>

  • The state of connection to an incoming mail server (<mailName>).

  • There's a metric for all configured incoming mail servers.

Shared storage metrics
com.atlassian.confluence:type=metrics,
category00=home,category01=shared,
category02=write,category03=latency,
name=value

home.shared.write.latency.value

  • The median latency of writing a small file (~30 bytes) to the shared home.

com.atlassian.confluence:type=metrics,
category00=home,category01=shared,
category02=write,category03=latency,
name=statistics

home.shared.write.latency.statistics

  • Aggregated latency statistics of writing a small file (~30 bytes) to the shared home

Local storage metrics
com.atlassian.confluence:type=metrics,
category00=home,category01=local,
category02=write,category03=latency,
category04=synthetic,name=value

home.local.write.latency.synthetic.value

  • The median latency of writing a small file (~30 bytes) to the local home with guaranteed persistence

com.atlassian.confluence:type=metrics,
category00=home,category01=local,
category02=write,category03=latency,
category04=synthetic,name=statistics

home.local.write.latency.synthetic.statistics

  • Aggregated latency statistics of writing a small file (~30 bytes) to the local home with guaranteed persistence

com.atlassian.confluence:type=metrics,
category00=home,category01=local,
category02=write,category03=latency,
category04=indexwriter,name=statistics

home.local.write.latency.indexwriter.statistics

  • Aggregated latency statistics to persist the current index buffer.

  • The metric is updated only when index changes are persisted.

User directory metrics
com.atlassian.confluence:type=metrics,
category00=user,category01=directory,
category02=connection,category03=latency,
name=value,tag.userDirName=<directoryName>

user.directory.connection.latency.value
userDirName=<directoryName>

  • The latest value of latency to search a single user in the external user directory (<directoryName>).

  • There's a metric for every external user directory.

com.atlassian.confluence:type=metrics,
category00=user,category01=directory,
category02=connection,category03=latency,
name=statistics,tag.userDirName=<directoryName>

user.directory.connection.latency.statistics
userDirName=<directoryName>

  • Aggregated latency statistics to search a single user in the external user directory (<directoryName>).

  • There's a metric for every external user directory.

com.atlassian.confluence:type=metrics,
category00=user,category01=directory,
category02=connection,category03=state,
name=custom,tag.userDirName=<directoryName>

user.directory.connection.state.custom
userDirName=<directoryName>

  • The state of connection to an external user directory (<directoryName>). Checks if a connection to a remote server can be established.

  • There's a metric for every external user directory.

Synchrony metrics
com.atlassian.confluence:type=metrics,
category00=synchrony,category01=connection,
category02=state,name=custom

synchrony.connection.state.custom

To learn more details about the infrastructure metrics, check the article Interpreting infrastructure metrics for in-product diagnostics.

To get more details on cross-product metrics, check the article Interpreting cross-product metrics for in-product diagnostics.

Enabling in-product diagnostics monitoring

IPD monitoring is enabled by default. To manage it:

  1. Go to Administration  > General Configuration

  2. In the left panel, select Monitoring.

  3. Use the Enable in-product diagnostics toggle to enable or disable IPD monitoring.

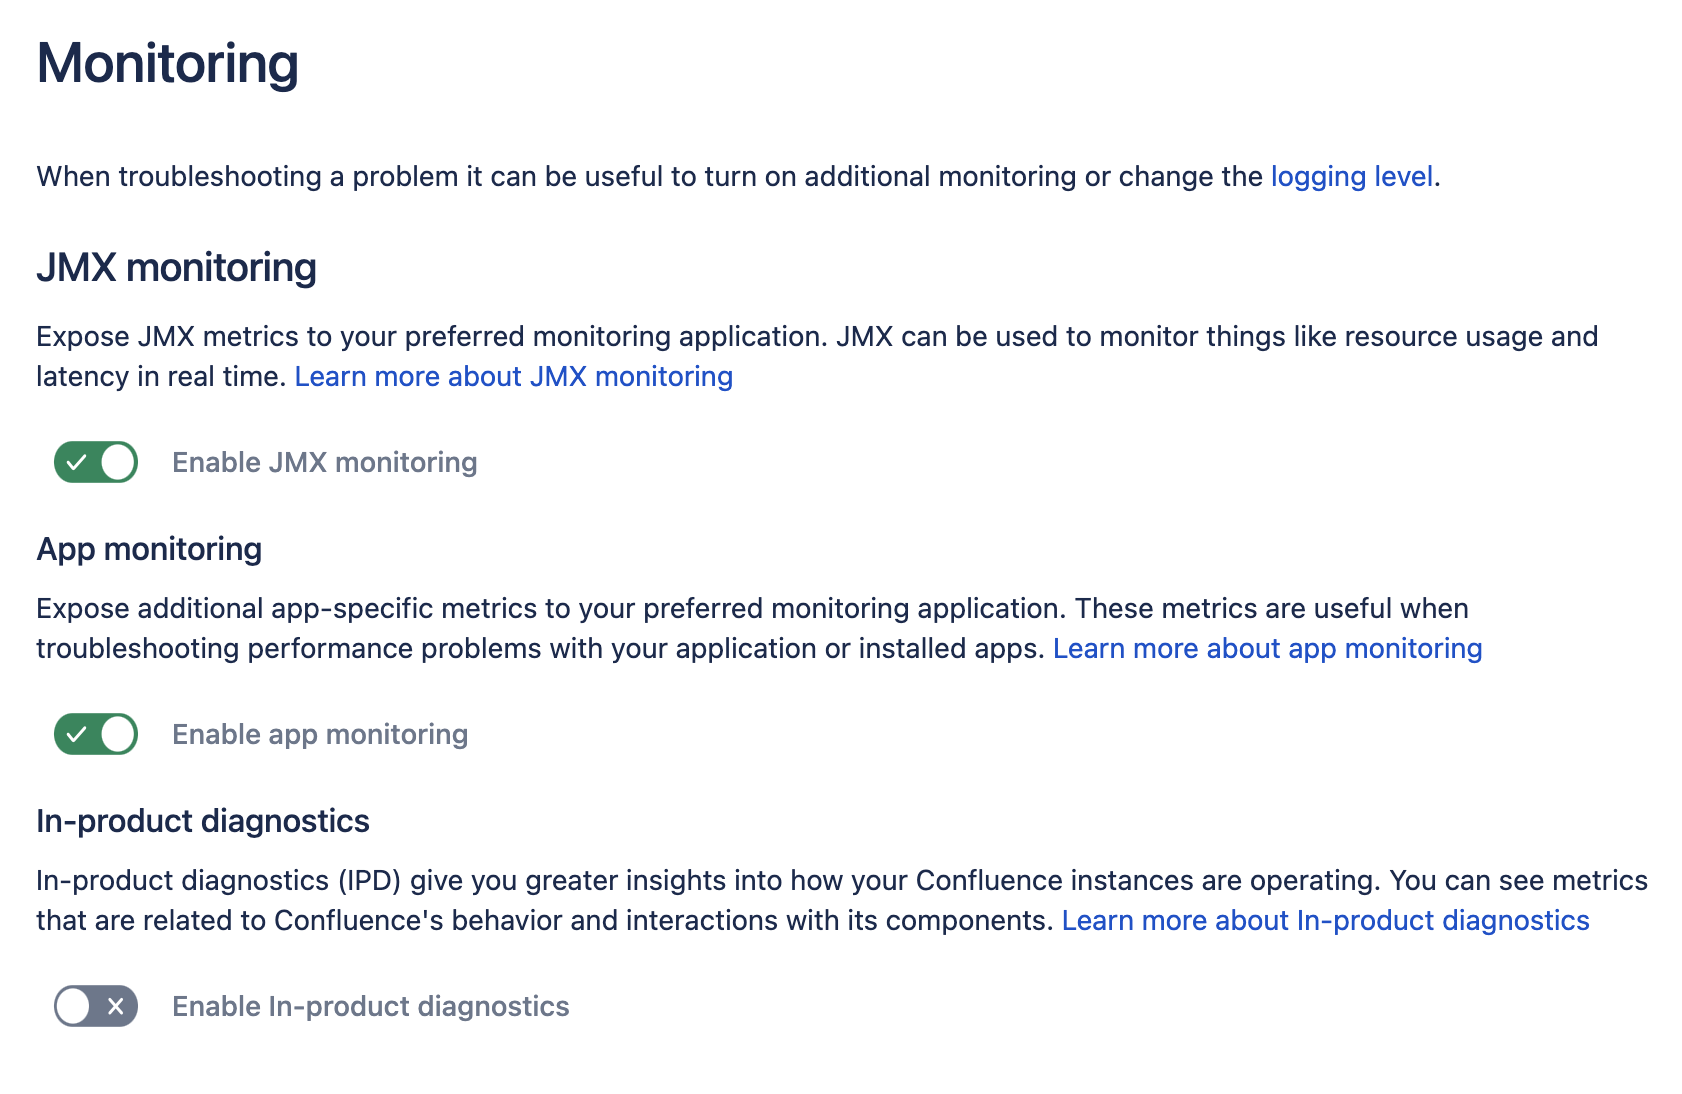
Screenshot: JMX monitoring settings with in-product diagnostics disabled

Log formatting

Writing to atlassian-confluence-ipd-monitoring.log is done via log4j. Its configuration is managed in log4j.properties.

#####################################################
# In-product diagnostics monitoring logging
#####################################################

log4j.appender.ipdLogAppender=com.atlassian.confluence.logging.ConfluenceHomeLogAppender
log4j.appender.ipdLogAppender.LogFileName=atlassian-confluence-ipd-monitoring.log
log4j.appender.ipdLogAppender.MaxFileSize=20480KB
log4j.appender.ipdLogAppender.MaxBackupIndex=5
log4j.appender.ipdLogAppender.layout=com.atlassian.logging.log4j.NewLineIndentingFilteringPatternLayout
log4j.appender.ipdLogAppender.layout.ConversionPattern=%d %m%n

log4j.logger.ipd-monitoring = INFO, consolelog
log4j.additivity.ipd-monitoring = false
log4j.logger.ipd-monitoring-data-logger = INFO, ipdLogAppender
log4j.additivity.ipd-monitoring-data-logger = false

Log contents

By default, a concise set of data is included in each log entry. An extended set of data can be logged by enabling the confluence.in.product.diagnostics.extended.logging feature flag.

To enable the extended data:

  1. Go to <CONFLUENCE_URL>/admin/darkfeatures.action, where <CONFLUENCE_URL> is the base URL of your Confluence instance.

  2. In the Enable dark feature field, enter confluence.in.product.diagnostics.extended.logging

  3. Select SubmitLearn how to manage dark features

    1. To disable the extended data, in the Site Dark Features section, find confluence.in.product.diagnostics.extended.logging and select remove.

In the following tables, see the structures of the concise and extended logging formats.

The metrics in JMX always go in the extended format.

Learn more about metric attributes


Concise data

MBean Type

Properties

Attributes

Counter

timestamp

label

attributes

_count

Value

_value

Statistics

_99thPercentile

_max

_min

_mean

Show me an example of the concise log line format
2023-01-13 11:51:13,106 IPDMONITORING {"timestamp":"1673610673","label":"DB.CONNECTION.POOL.NUMACTIVE.STATISTICS","attributes":{"_max":"2.0","_mean":"1.2436699769063984","_99thPercentile":"2.0","_count":"5","_min":"1.0"}}

Extended data

MBean Type

Properties

Attributes

Counter

timestamp

label

attributes

objectName

_count

_fifteenMinuteRate

_fiveMinuteRate

_meanRate

_oneMinuteRate

_rateUnit

Value

_value

_number

Statistics

_50thPercentile

_75thPercentile

_95thPercentile

_98thPercentile

_99thPercentile

_999thPercentile

_count

_min

_max

_mean

_stdDev

_durationUnit

_fifteenMinuteRate

_fiveMinuteRate

_meanRate

_oneMinuteRate

_rateUnit

Show me an example of the extended log line format
2022-09-06 18:38:48,015 IPDMONITORING {"timestamp":"1662453528","label":
"DB.CONNECTION.LATENCY.STATISTICS","objectName":
"com.atlassian.confluence:category00\u003ddb,category01\u003dconnection,category02\
u003dlatency,name\u003dstatistics,type\u003dmetrics",
"attributes":{"_oneMinuteRate":"0.02012497818617073","_50thPercentile":"0.0",
"_mean":"1.9379304604014412E-25","_max":"1.0","_stdDev":"4.40219315841711E-13",
"_98thPercentile":"0.0","_meanRate":"0.003612560785169162","_rateUnit":
"events/second","_99thPercentile":"0.0","_count":"16","_durationUnit":
"milliseconds","_75thPercentile":"0.0","_fiveMinuteRate":
"0.005912972095043379","_fifteenMinuteRate":"0.0037696657500141968",
"_999thPercentile":"0.0","_95thPercentile":"0.0","_min":"0.0"}}

Definitions of metric attributes

Expand the following sections to learn more about metric attributes.

Counter metric attributes

Attribute

Definition

_count

The number of occurrences of a metric within the current time window

_fifteenMinuteRate

The number of occurrences of a metric over the last 15 minutes

_fiveMinuteRate

The number of occurrences of a metric over the last five minutes

_meanRate

The mean rate at which events have occurred since the meter was created

_oneMinuteRate

The number of occurrences of a metric over the last one minute

_rateUnit

The unit of measure used for rates

Pay attention to the following attributes:  _oneMinuteRate, _fiveMinuteRate, and _fifteenMinuteRate.

The _count gives no indication of how the measurements have changed over time. A sense of recency is provided with the minute rates.

Value metric attributes

Attribute

Definition

_value

A most recently sampled value of the metric

_number

Contains the same value as the _value attribute

Statistics metric attributes

The metrics of the statistics MBean type are also known as aggregated values. They provide statistics for the items that have been subjected to any changes over a period of time. For example, for the items that have been processed in a mail queue or added to an error mail queue.

Time window

Unless stated, aggregated values are calculated over a sliding time window. It covers the last five minutes, approximately.

Percentile values are calculated using a reservoir sampling technique. This technique uses a small, manageable set of values that is statistically representative of the data stream as a whole, hence reducing the quantity of data that must be held in memory.

Resets

Outside of the sliding time window, all aggregated values are reset:

  • After each system restart.

  • After each time JMX monitoring or in-product diagnostic metrics are enabled.

Learn more about JMX monitoring and in-product diagnostic in other Data Center products:

In the following table, find the definitions of statistics metric attributes.

Attribute

Definition

_50thPercentile

A measured value below which 50% of all measurements can be found within the current time window; also referred to as the median value.

This attribute provides an alternative to the mean as a representation of the middle measurement. The median is less likely to be skewed by outlier values than the mean.

_75thPercentile

The measured value below 75% of all measurements that can be found within the current time window; the third quartile value

_95thPercentile

The measured value below 95% of all measurements that can be found within the current time window

_98thPercentile

The measured value below 98% of all measurements that can be found within the current time window

_99thPercentile

The measured value below 99% of all measurements that can be found within the current time window

_999thPercentile

The measured value below 999% of all measurements that can be found within the current time window

_count

The number of occurrences of a metric within the current time window

_min

The minimum measured value within the current time window

_max

The maximum measure value within the current time window; the statistical range between _max and _min provides a measure of values variability

_mean

The average value within the current time window.

This attribute can be skewed by large outlier measurements. In such cases, the _50thPercentile provides a better measure of the middle value.

_stdDev

A measure of the data variability.

A low standard deviation indicates that the values tend to be close to the mean of the set, while a high standard deviation indicates that the values are spread out over a wider range of values.

_durationUnit

The unit of measure used for durations

_fifteenMinuteRate

The number of occurrences of a metric over the last 15 minutes

_fiveMinuteRate

The number of occurrences of a metric over the last five minutes

_meanRate

The mean rate at which events have occurred since the meter was created

_oneMinuteRate

The number of occurrences of a metric over the last one minute

_rateUnit

The unit of measure used for rates

Pay attention to the following attributes:  _oneMinuteRate, _fiveMinuteRate, and _fifteenMinuteRate.

The _count gives no indication of how the measurements have changed over time. A sense of recency is provided with the minute rates.

Last modified on Feb 8, 2024

Was this helpful?

Yes
No
Provide feedback about this article
Powered by Confluence and Scroll Viewport.