Monitor application performance
Configure a JMX Exporter
The exporter takes the JMX MBeans and transforms them into the right format for Prometheus. It also hosts an HTTP endpoint which Prometheus will connect to. Learn more about the Prometheus JMX exporter
If you don't plan to use Prometheus, you'll need to check which exporter or agent is required for your APM solution. For example, this Java agent for NewRelic.
To install the exporter:
Download the Prometheus JMX exporter jar file from the GitHub repository.
$ curl -L https://repo1.maven.org/maven2/io/prometheus/jmx/jmx_prometheus_javaagent/0.16.1/jmx_prometheus_javaagent-0.16.1.jar > jmx-exporter.jarCreate a configuration file for the Java exporter. We recommend you use the jmx-exporter-config.yml configuration file provided in our repository.
Copy the jar file and configuration file to each application node (the local home directory is a good option).
Stop Confluence on one node.
Add the following system properties to tell Confluence where to find the JMX exporter. See Configuring System Properties to check how to do this for your site.
-javaagent:<full-path-to-jmx-exporter-jar>=<port>:<full-path-to-jmx-exporter-config.yml>The JMX exporter defaults to port 8080. You'll need to specify a different port for the exporter if 8080 is in use by another application.
- Start Confluence.
- To check that the exporter is working, go to
localhost:<jmx-exporter-port>. You should see the metrics output.
If you run Confluence in a cluster, repeat steps for all remaining nodes. To avoid downtime, you can perform a rolling restart.
Make sure the JMX exporter endpoint is not exposed outside your network, or take appropriate steps to secure it.
Check that app monitoring is enabled
App monitoring uses JMX (Java Management Extensions), so you'll need to check that both JMX monitoring and App monitoring are enabled. These are both enabled by default.
To confirm app monitoring is enabled:
- Go to Administration menu
 , then General Configuration > Monitoring.
 - Check that JMX monitoring is enabled.
Check that App monitoring is enabled.
If you have previously set up JMX monitoring for Confluence, there’s nothing else you need to do. The additional app monitoring metrics will be exposed in the same way as existing application metrics.
Identify the app name
App metrics include the plugin key rather than the app's display name. For example, com.atlassian.troubleshooting.plugin-confluence is the plugin key for the Troubleshooting and Support Tools system app for Confluence.
To find the app name:
- Go to
<base-url>/plugins/servlet/upm/osgi - Enter the plugin key in the Search bundled metadata field
- The app details will be returned, including the name and vendor.
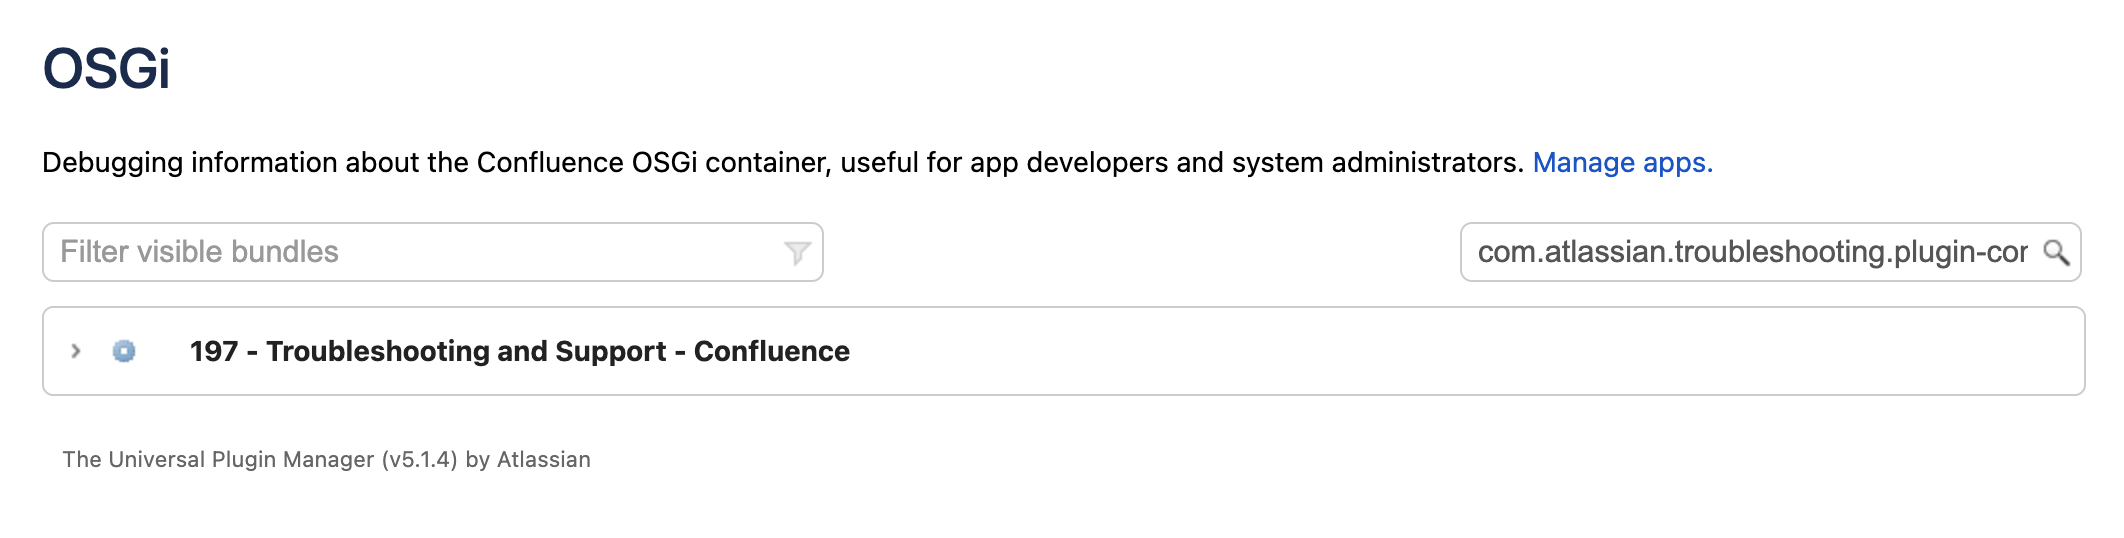
OSGi admin screen showing search results for a plugin key
Enable optional tags
App vendors can choose to include additional metadata which can help when troubleshooting a performance issues. These tags are not included by default.
You can use the atlassian.metrics.optional.tags system property to show additional tags for a metric.
atlassian.metrics.optional.tags.<metric-name>=<tag-key1>,<tag-key2>Disable app monitoring
To disable app monitoring:
- Go to Administration menu , then General Configuration > Monitoring.
- Disable App monitoring.
Once disabled, Confluence will no longer emit app-specific metrics, or write them to logs. If you want to disable JMX altogether, you can also disable JMX monitoring.
Troubleshooting
JMX disabled via system property
JMX is enabled in Confluence by default, and previously could only be disabled using a system property. You’ll see a warning on the Monitoring page if the confluence.jmx.disabled property is set on any of your nodes.
You won’t be able to toggle JMX monitoring on or off through the Monitoring screen until you have removed the system property.
Out-of-memory errors
Because the monitoring is happening outside your application, we don’t expect there to be a significant impact on your instance performance or stability.
In the event you do notice increased memory usage, or out of memory errors (OOME) caused by the monitoring agent, you may want to increase the minimum heap size (Xms) in the setenv file. See Fix java.lang.OutOfMemoryError in Confluence.
Next steps
Next, configure your APM tool to point to the JMX exporter endpoint. If you don't have an APM, check out guide to setting up Prometheus and Grafana.
See App metrics reference for a full list of app metrics, and recommended alerts.